Shiba Inu (SHIB) technical analysis:
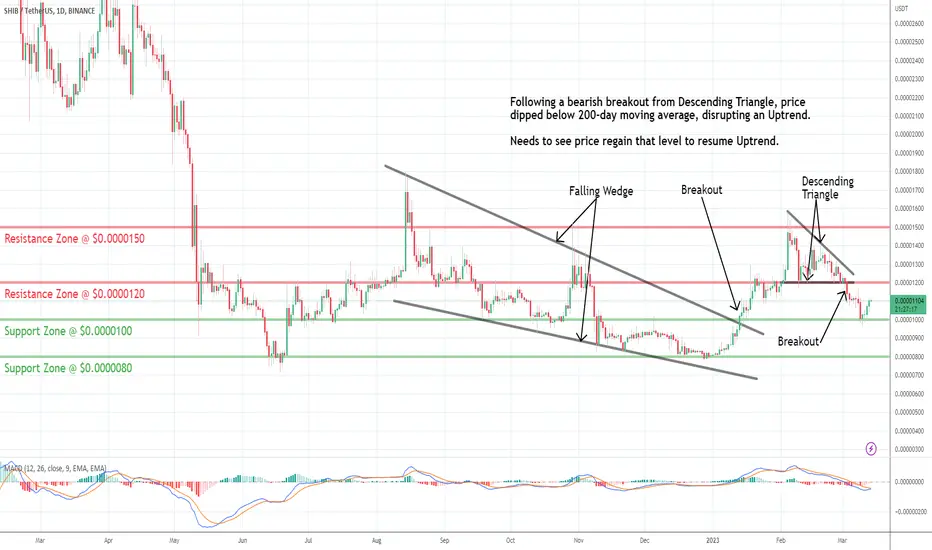
Trade setup: Following a bearish breakout from Descending Triangle price dipped below 200-day moving average. Trends are mixed now. Price needs to regain that 200-day MA and $0.000012 levels to resume Uptrend.
Trend: Downtrend on Short- and Medium-Term basis and Uptrend on Long-Term basis.
Momentum is Bearish but inflecting. MACD Line is below MACD Signal Line and RSI is below 45 but momentum may have bottomed since MACD Histogram bars are rising, which suggests that momentum could be nearing another upswing.
Support and Resistance: Nearest Support Zone is $0.000010, then $0.000008. The nearest Resistance Zone is $0.000012 (previous support), then $0.0000150.
Disclaimer
The information and publications are not meant to be, and do not constitute, financial, investment, trading, or other types of advice or recommendations supplied or endorsed by TradingView. Read more in the Terms of Use.
Disclaimer
The information and publications are not meant to be, and do not constitute, financial, investment, trading, or other types of advice or recommendations supplied or endorsed by TradingView. Read more in the Terms of Use.