Hello dear traders,
*Mars Signals Team wishes you high profits*
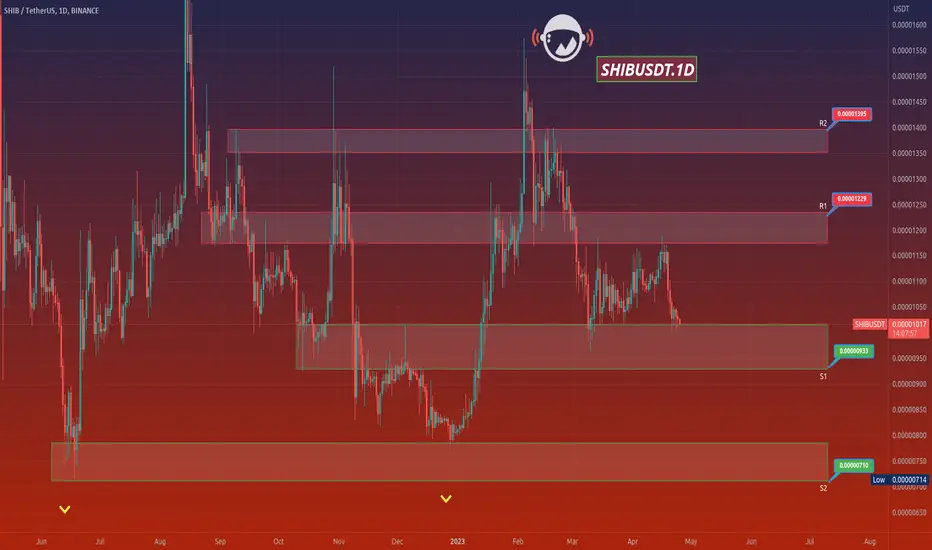
This is a one-day-time frame analysis for SHIBUSDT
Obviously R2 on the top of this chart are our resistance areas which demonstrate the disability of the price to rise. R1 used to be a support area. And we have S1 and S2 that are two support areas in the current chart with their support of price at several points even in the past. The price was supported at S2 and then it faced a rise up to R2. But when it was rejected there, it fell down to S2 again and this time it had a noticeable fall after another rejection at R2. At the moment, it is moving over S1 area and it is predicted to have a recovery to the bottom of the mentioned area and via providing us some rising signs and confirmation candles for this purpose, it would have a rise upward to touch R1 or more than that to R2 by having more fixation above R1. But remember that by the time the price loses the support at S1 and falls toward S2, this will be a proper point to enter trading and put your sale orders when the price is on the rise after being supported at S2. So put your stop-loss below this area and wait for a good moment to do your next action. You must check every detail and information before doing anything. If you are looking for wise trades and less risky ones, our suggestion will be following our regular updates all the time.
Warning: This is just a suggestion and we do not guarantee profits. We advise you to analyze the chart before opening any positions.
Take care
*Mars Signals Team wishes you high profits*
This is a one-day-time frame analysis for SHIBUSDT
Obviously R2 on the top of this chart are our resistance areas which demonstrate the disability of the price to rise. R1 used to be a support area. And we have S1 and S2 that are two support areas in the current chart with their support of price at several points even in the past. The price was supported at S2 and then it faced a rise up to R2. But when it was rejected there, it fell down to S2 again and this time it had a noticeable fall after another rejection at R2. At the moment, it is moving over S1 area and it is predicted to have a recovery to the bottom of the mentioned area and via providing us some rising signs and confirmation candles for this purpose, it would have a rise upward to touch R1 or more than that to R2 by having more fixation above R1. But remember that by the time the price loses the support at S1 and falls toward S2, this will be a proper point to enter trading and put your sale orders when the price is on the rise after being supported at S2. So put your stop-loss below this area and wait for a good moment to do your next action. You must check every detail and information before doing anything. If you are looking for wise trades and less risky ones, our suggestion will be following our regular updates all the time.
Warning: This is just a suggestion and we do not guarantee profits. We advise you to analyze the chart before opening any positions.
Take care
Related publications
Disclaimer
The information and publications are not meant to be, and do not constitute, financial, investment, trading, or other types of advice or recommendations supplied or endorsed by TradingView. Read more in the Terms of Use.
Related publications
Disclaimer
The information and publications are not meant to be, and do not constitute, financial, investment, trading, or other types of advice or recommendations supplied or endorsed by TradingView. Read more in the Terms of Use.