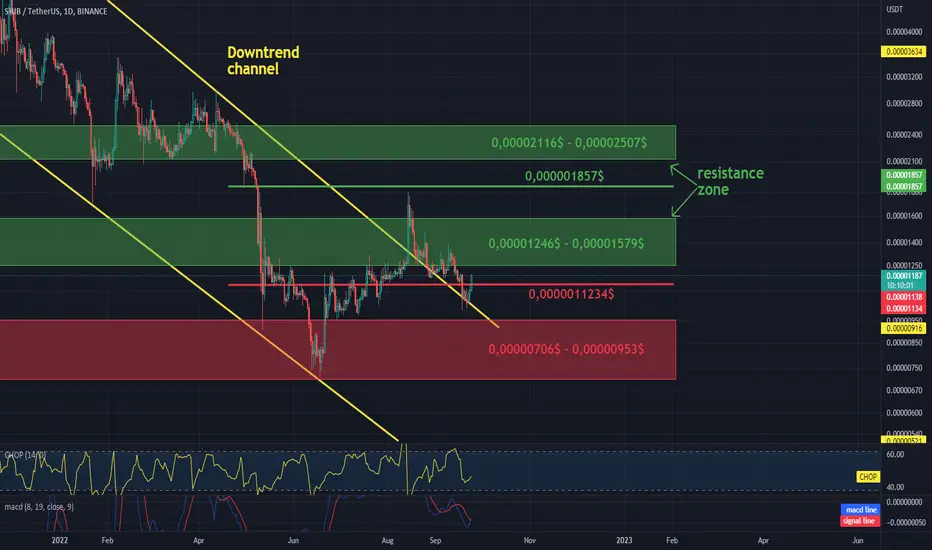
Hello everyone, let's take a look at the 1-day SHIBUSDT chart as we can see that the SHIB price has emerged from a prolonged downtrend.
Let's start by identifying the support that the shib price has on the way and as you can see the first support is $ 0.0000011234, but if it is raised, we already have a support zone from $ 0.00000706 to $ 0.00000953.
Now we will turn our attention to the resistance that we need to overcome in order for the price to rise further. In the first place, we have a support zone from $ 0.00001246 to $ 0.00001579, the next resistance is at $ 0.5328 and then a second support zone from $ 0.00002116 to $ 0.00002507.
It is worth paying attention to the CHOP indicator, which shows that the energy is slowly starting to rise, and the MACD indicator indicates that we have entered an upward trend.
Disclaimer
The information and publications are not meant to be, and do not constitute, financial, investment, trading, or other types of advice or recommendations supplied or endorsed by TradingView. Read more in the Terms of Use.
Disclaimer
The information and publications are not meant to be, and do not constitute, financial, investment, trading, or other types of advice or recommendations supplied or endorsed by TradingView. Read more in the Terms of Use.