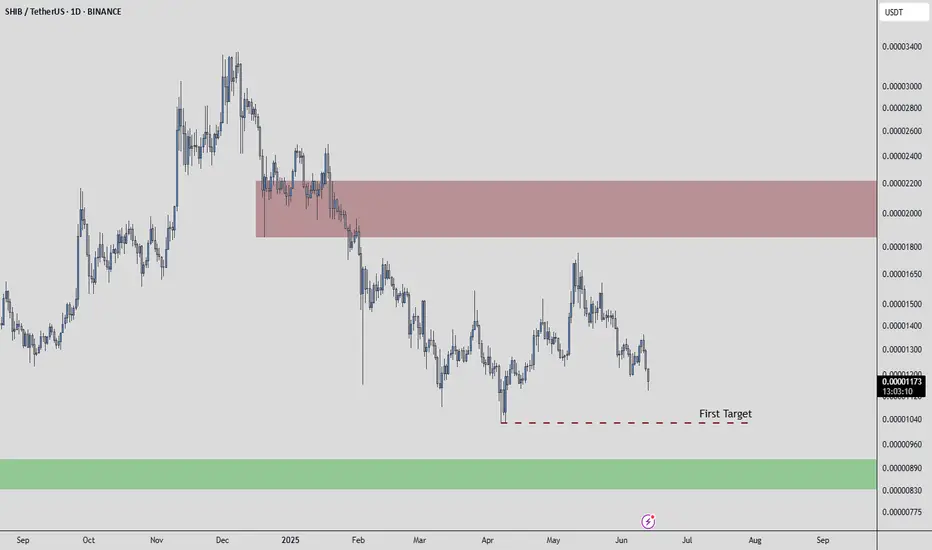
My focus is on SHIBUSDT, and the picture is clear: price is weak. This isn't a market where buyers are proving their strength; in fact, the opposite is true.
Most traders are confused by volatility. But you need to see the real opportunity. My analysis points to this: both red boxes I've marked on the chart are prime zones for short opportunities. They represent powerful selling regions.
Here's why, and your plan for action:
Red Box Power: These zones are where sellers are truly in control. I'm actively looking for price to engage with these areas.
Green Box Uncertainty: As for the green box, its strength is questionable. I'm not confident it will hold as reliable support for a bullish move, reinforcing my overall bearish view.
Confirm the Downside: Your decisive move comes with confirmation:
Volume Footprint: I'll be scrutinizing the volume footprint to see clear distribution from sellers.
CDV (Cumulative Delta Volume): Look for CDV to turn deeply negative, affirming seller dominance.
LTF Breakdowns: On the low timeframes (LTF), demand concrete breakdowns. Price must fail, retest the red boxes as resistance, and then continue lower. This is your undeniable signal.
My general bias remains bearish. I only trade assets showing a sudden increase in volume, and while this is a short setup, the volume dynamics confirming weakness are what I'm seeking.
Keep a sharp eye on those red boxes. If these confirmations line up, you'll uncover precise, high-probability short entries. This is where smart, confirmed decisions are made.
📌I keep my charts clean and simple because I believe clarity leads to better decisions.
📌My approach is built on years of experience and a solid track record. I don’t claim to know it all but I’m confident in my ability to spot high-probability setups.
📌If you would like to learn how to use the heatmap, cumulative volume delta and volume footprint techniques that I use below to determine very accurate demand regions, you can send me a private message. I help anyone who wants it completely free of charge.
🔑I have a long list of my proven technique below:
I stopped adding to the list because it's kinda tiring to add 5-10 charts in every move but you can check my profile and see that it goes on..
Most traders are confused by volatility. But you need to see the real opportunity. My analysis points to this: both red boxes I've marked on the chart are prime zones for short opportunities. They represent powerful selling regions.
Here's why, and your plan for action:
Red Box Power: These zones are where sellers are truly in control. I'm actively looking for price to engage with these areas.
Green Box Uncertainty: As for the green box, its strength is questionable. I'm not confident it will hold as reliable support for a bullish move, reinforcing my overall bearish view.
Confirm the Downside: Your decisive move comes with confirmation:
Volume Footprint: I'll be scrutinizing the volume footprint to see clear distribution from sellers.
CDV (Cumulative Delta Volume): Look for CDV to turn deeply negative, affirming seller dominance.
LTF Breakdowns: On the low timeframes (LTF), demand concrete breakdowns. Price must fail, retest the red boxes as resistance, and then continue lower. This is your undeniable signal.
My general bias remains bearish. I only trade assets showing a sudden increase in volume, and while this is a short setup, the volume dynamics confirming weakness are what I'm seeking.
Keep a sharp eye on those red boxes. If these confirmations line up, you'll uncover precise, high-probability short entries. This is where smart, confirmed decisions are made.
📌I keep my charts clean and simple because I believe clarity leads to better decisions.
📌My approach is built on years of experience and a solid track record. I don’t claim to know it all but I’m confident in my ability to spot high-probability setups.
📌If you would like to learn how to use the heatmap, cumulative volume delta and volume footprint techniques that I use below to determine very accurate demand regions, you can send me a private message. I help anyone who wants it completely free of charge.
🔑I have a long list of my proven technique below:
- 🎯 ZENUSDT.P: Patience & Profitability | %230 Reaction from the Sniper Entry
- 🐶 DOGEUSDT.P: Next Move
- 🎨 RENDERUSDT.P: Opportunity of the Month
- 💎 ETHUSDT.P: Where to Retrace
- 🟢 BNBUSDT.P: Potential Surge
- 📊 BTC Dominance: Reaction Zone
- 🌊 WAVESUSDT.P: Demand Zone Potential
- 🟣 UNIUSDT.P: Long-Term Trade
- 🔵 XRPUSDT.P: Entry Zones
- 🔗 LINKUSDT.P: Follow The River
- 📈 BTCUSDT.P: Two Key Demand Zones
- 🟩 POLUSDT: Bullish Momentum
- 🌟 PENDLEUSDT.P: Where Opportunity Meets Precision
- 🔥 BTCUSDT.P: Liquidation of Highly Leveraged Longs
- 🌊 SOLUSDT.P: SOL's Dip - Your Opportunity
- 🐸 1000PEPEUSDT.P: Prime Bounce Zone Unlocked
- 🚀 ETHUSDT.P: Set to Explode - Don't Miss This Game Changer
- 🤖 IQUSDT: Smart Plan
- ⚡️ PONDUSDT: A Trade Not Taken Is Better Than a Losing One
- 💼 STMXUSDT: 2 Buying Areas
- 🐢 TURBOUSDT: Buy Zones and Buyer Presence
- 🌍 ICPUSDT.P: Massive Upside Potential | Check the Trade Update For Seeing Results
- 🟠 IDEXUSDT: Spot Buy Area | %26 Profit if You Trade with MSB
- 📌 USUALUSDT: Buyers Are Active + %70 Profit in Total
- 🌟 FORTHUSDT: Sniper Entry +%26 Reaction
- 🐳 QKCUSDT: Sniper Entry +%57 Reaction
- 📊 BTC.D: Retest of Key Area Highly Likely
- 📊 XNOUSDT %80 Reaction with a Simple Blue Box!
- 📊 BELUSDT Amazing %120 Reaction!
- 📊 Simple Red Box, Extraordinary Results
- 📊 TIAUSDT | Still No Buyers—Maintaining a Bearish Outlook
- 📊 OGNUSDT | One of Today’s Highest Volume Gainers – +32.44%
- 📊 TRXUSDT - I Do My Thing Again 📊 FLOKIUSDT - +%100 From Blue Box! 📊 SFP/USDT - Perfect Entry %80 Profit! 📊 [https://tradingview.sweetlogin.com/chart/AAVEUSDT/RZ4eezbi-AAVEUSDT-Analysis-Retracement-Opportunity/]AAVEUSDT - WE DID IT AGAIN!
I stopped adding to the list because it's kinda tiring to add 5-10 charts in every move but you can check my profile and see that it goes on..
Professional Day Trader
Microstructure Practicioner
t.me/umuttrades
kick.com/umuttrades live everyday.
Microstructure Practicioner
t.me/umuttrades
kick.com/umuttrades live everyday.
Related publications
Disclaimer
The information and publications are not meant to be, and do not constitute, financial, investment, trading, or other types of advice or recommendations supplied or endorsed by TradingView. Read more in the Terms of Use.