Shiba Inu (SHIB) technical analysis:
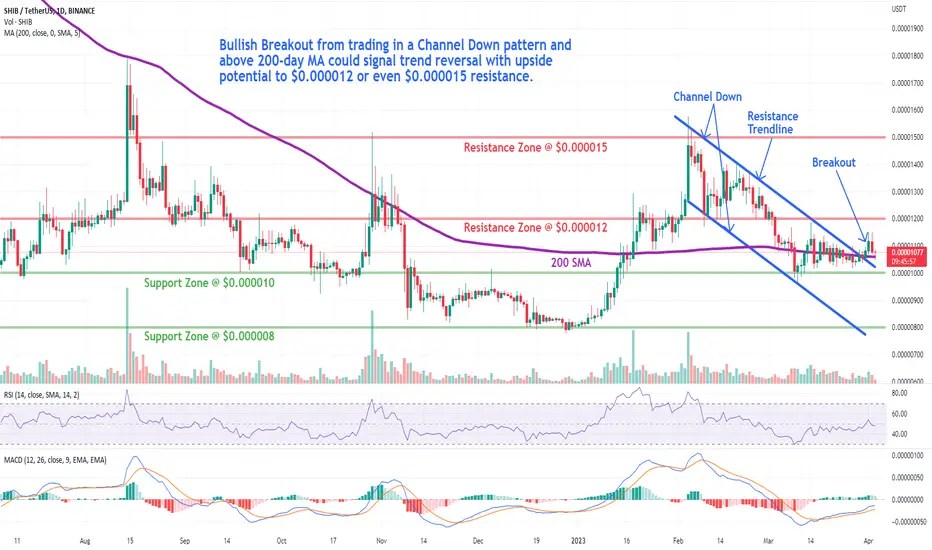
Trade setup: Bullish Breakout from trading in a Channel Down pattern and above 200-day MA could signal trend reversal with upside potential to $0.000012 or even $0.000015 resistance.
Pattern: Price was trading in a Channel Down pattern. With emerging patterns, traders who believe the price is likely to remain within its channel can initiate trades when the price fluctuates within its channel trendlines. With complete patterns (i.e. a breakout) – initiate a trade when the price breaks through the channel’s trendlines, either on the upper or lower side. When this happens, the price can move rapidly in the direction of that breakout.
Trend: Downtrend on Medium-Term basis and Uptrend on Short- and Long-Term basis.
Momentum is Mixed as MACD Line is above MACD Signal Line (Bullish) but RSI ~ 50 (Neutral).
Support and Resistance: Nearest Support Zone is $0.000010, then $0.000008. The nearest Resistance Zone is $0.000012 (previous support), then $0.0000150.
Disclaimer
The information and publications are not meant to be, and do not constitute, financial, investment, trading, or other types of advice or recommendations supplied or endorsed by TradingView. Read more in the Terms of Use.
Disclaimer
The information and publications are not meant to be, and do not constitute, financial, investment, trading, or other types of advice or recommendations supplied or endorsed by TradingView. Read more in the Terms of Use.