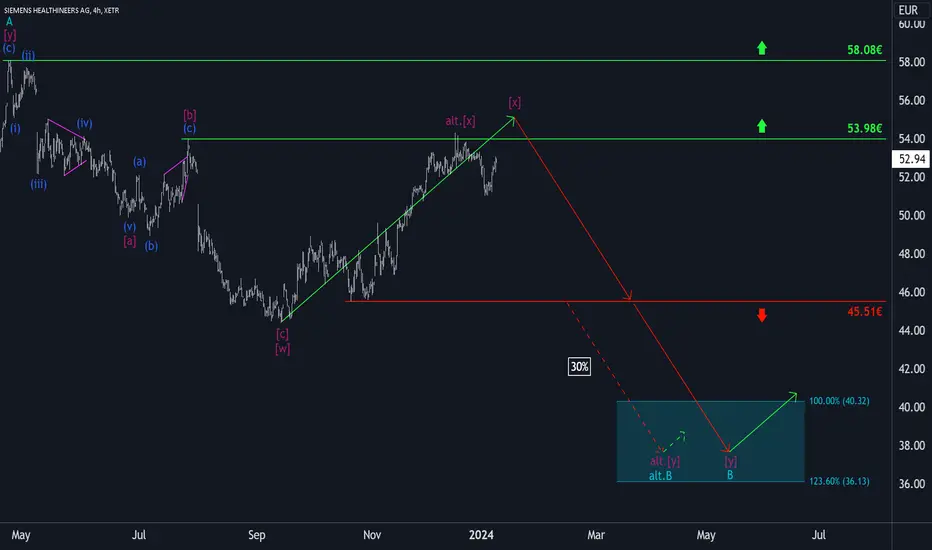
Siemens Healthineers took a step south at the beginning of the year, but has since almost made up for this setback on the upside. Nevertheless, we have drawn up a new alternative scenario with a 30% probability on the chart, according to which the current rise would already be completed with the last high in the form of the magenta-colored wave alt.(X). Accordingly, the price would fall below the support level of €45.51 earlier and consequently into our turquoise-colored Target Zone between €40.32 and €36.13. As part of our primary scenario, however, we give the stock a little more room on the upside - namely until just above the resistance at €53.98 - in order to underpin the top of the regular magenta-colored wave (x). Only then should it dive into the turquoise Target Zone.
📊 Free daily market insights combining macro + Elliott Wave analysis
🚀 Spot trends early with momentum, sentiment & price structure
🌐 Join thousands trading smarter - full free analyses at dailymarketupdate.com
🚀 Spot trends early with momentum, sentiment & price structure
🌐 Join thousands trading smarter - full free analyses at dailymarketupdate.com
Related publications
Disclaimer
The information and publications are not meant to be, and do not constitute, financial, investment, trading, or other types of advice or recommendations supplied or endorsed by TradingView. Read more in the Terms of Use.