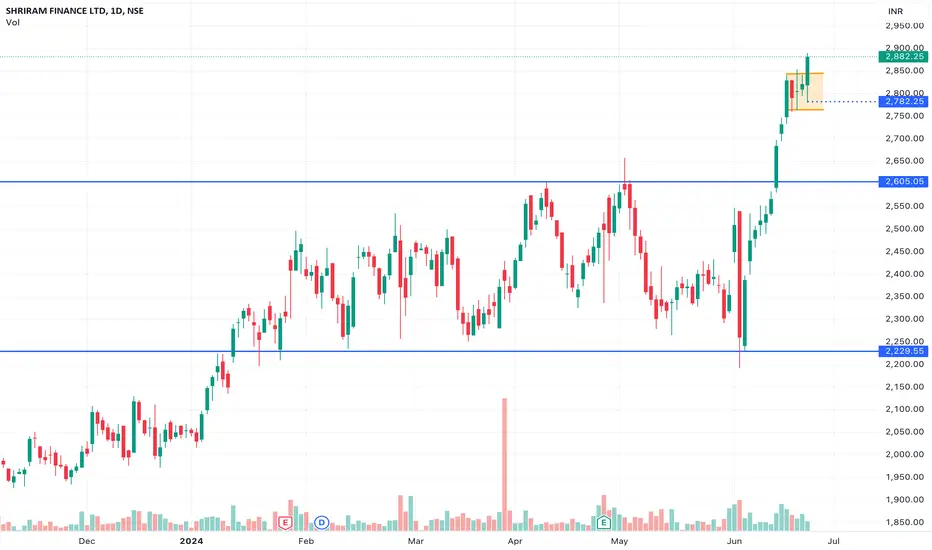
Shriram Finance Ltd.'s recent price action presents a classic bullish flag pattern, indicating a potential continuation of the upward trend. This pattern, characterized by a sharp rise followed by a brief consolidatory period, suggests that the stock could be gearing up for another leg higher. Traders should monitor for a breakout above the consolidation zone as a confirmation of bullish momentum, which could offer a favorable opportunity for long positions. This setup offers a strategic point for traders to capitalize on the underlying strength of Shriram Finance.
Note
Move Stop Loss to BreakevenTrade closed manually
Closed in Profit.The chart for Shriram Finance Ltd shows a recent bearish candle, indicating potential downward pressure following a strong upward trend. Given this signal, it might be prudent to close the trade to avoid potential losses if you anticipate a reversal or a significant pullback in the stock's price.
Disclaimer
The information and publications are not meant to be, and do not constitute, financial, investment, trading, or other types of advice or recommendations supplied or endorsed by TradingView. Read more in the Terms of Use.
Disclaimer
The information and publications are not meant to be, and do not constitute, financial, investment, trading, or other types of advice or recommendations supplied or endorsed by TradingView. Read more in the Terms of Use.