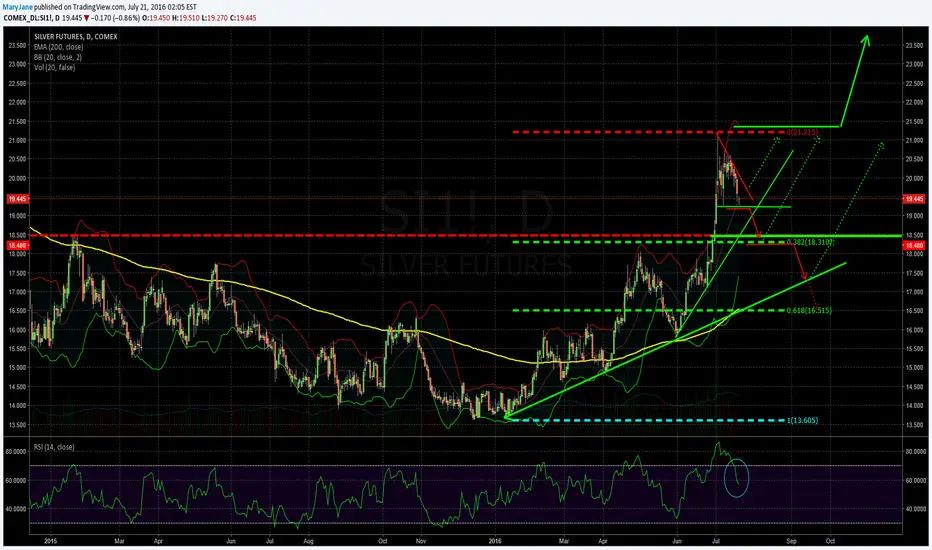
These days, the RSI generatet a shortsignal in this timeframe.
Prices above 19,2$ are still bullish (shortterm)
Prices below 19,2$ will perhaps cause a dip to the 38,2 fibo @ 18,3$ This Level is corresponding to a former high in the beginnings of 2015 and near the top from 05/2016.
Prices below that minimal correction Level (38,2) will turn the bullish momentum into bearish - the next TPs could be the uptrendline @ 17.25$ or the holy fibo 61,8 @ 16,5$ - here is also based the EMA 200as a supportlevel.
Prices above 21,25$ seem to be strong bullish
Note
they bought the Support @ 19.2 ..Prices above 20.65 will accelerate the upwave - next tp 21.20$ . Note
microstructure Note
overview Note
and here is the BO!!! Note
Silver reached very important Action Point on a higher timeframe! Note
YES! Note
Note
watch the RSI Note
Note
next upmove? Note
no further upmove at this Moment....but is there a new doentrend born? Note
have we seeen the top? Note
H&S TP reached Disclaimer
The information and publications are not meant to be, and do not constitute, financial, investment, trading, or other types of advice or recommendations supplied or endorsed by TradingView. Read more in the Terms of Use.
Disclaimer
The information and publications are not meant to be, and do not constitute, financial, investment, trading, or other types of advice or recommendations supplied or endorsed by TradingView. Read more in the Terms of Use.