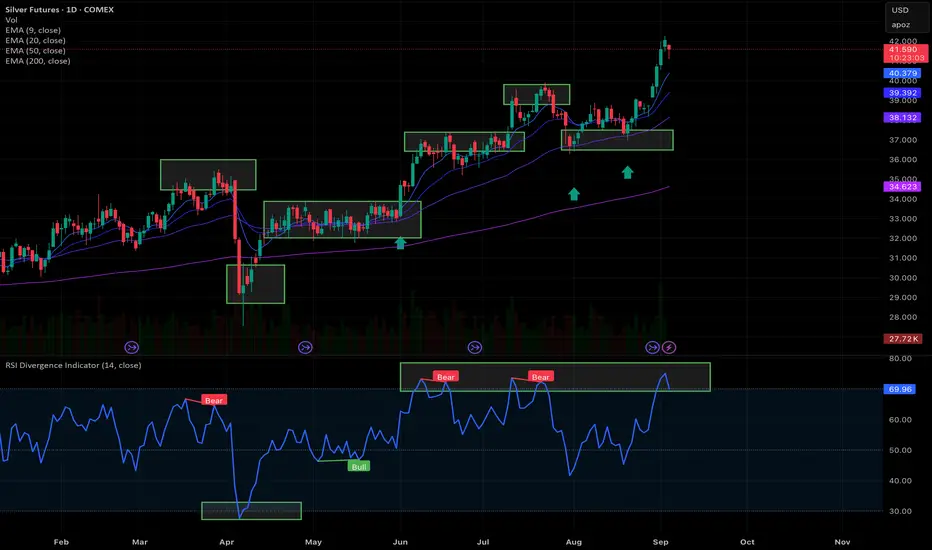
It’s hard to argue against technical analysis when you look at this chart in hindsight. A perfect blend of candlestick analysis(buyer/seller psychology), BBW vol compression move(notice the 10% move after 125 day low in vol), price respecting the 50 day moving average multiple times, and lastly, price reacting to overbought/oversold RSI levels.
Disclaimer
The information and publications are not meant to be, and do not constitute, financial, investment, trading, or other types of advice or recommendations supplied or endorsed by TradingView. Read more in the Terms of Use.
Disclaimer
The information and publications are not meant to be, and do not constitute, financial, investment, trading, or other types of advice or recommendations supplied or endorsed by TradingView. Read more in the Terms of Use.