📈
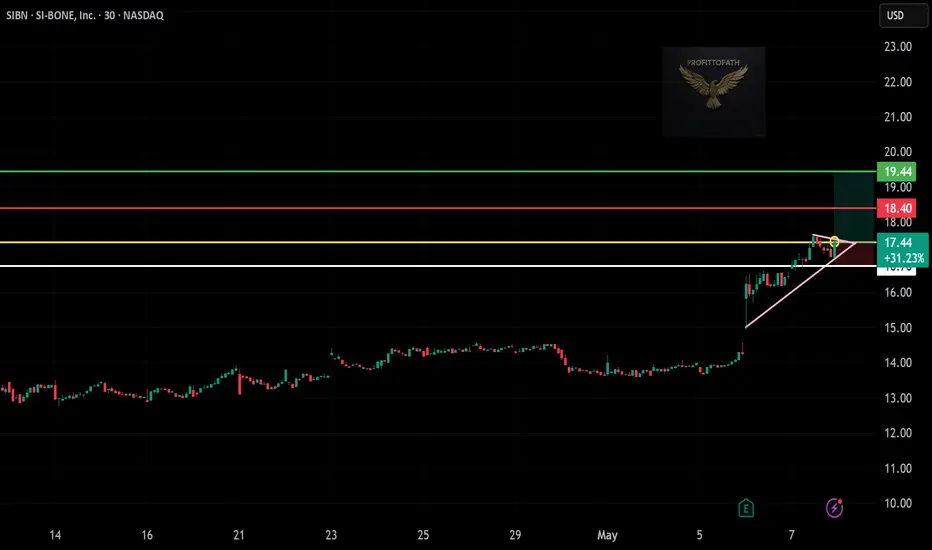
🔹 Asset: SI-BONE, Inc. (NASDAQ: SIBN)
🔹 Timeframe: 30-Minute Chart
🔹 Setup Type: Bullish Pennant Breakout
📌 Trade Plan (Long Position)
✅ Entry Zone: Above $17.44 (Breakout Confirmation)
✅ Stop-Loss (SL): Below $16.70 (Pennant Invalidation Level)
🎯 Take Profit Targets
📌 TP1: $18.40 – Recent Resistance Zone
📌 TP2: $19.44 – Measured Move Target
📊 Risk-Reward Calculation
📉 Risk: $17.44 - $16.70 = $0.74
📈 Reward to TP1: $18.40 - $17.44 = $0.96 → 1:1.29 R/R
📈 Reward to TP2: $19.44 - $17.44 = $2.00 → 1:2.70 R/R ✅
🔍 Technical Highlights
📌 Bullish pennant forming after strong rally
📌 Breakout candle confirmed with volume
📌 Clean structure with consolidation above previous high
📌 Favorable price action with momentum buildup
📈 Execution Strategy
📊 Enter after breakout candle above $17.44
📉 SL below pennant base ($16.70)
💰 Partial profits at TP1, trail rest toward TP2
🚨 Invalidation Risk
❌ Exit if price breaks below $16.70 with volume
❌ Weak follow-through = reduce position or exit early
🚀 Final Take
✔ Bullish continuation pattern with strong structure
✔ Excellent reward-to-risk setup
✔ Let momentum work for you — plan your trade, trade your plan
Disclaimer
The information and publications are not meant to be, and do not constitute, financial, investment, trading, or other types of advice or recommendations supplied or endorsed by TradingView. Read more in the Terms of Use.
Disclaimer
The information and publications are not meant to be, and do not constitute, financial, investment, trading, or other types of advice or recommendations supplied or endorsed by TradingView. Read more in the Terms of Use.