1. Resistance Zone May Be Weak
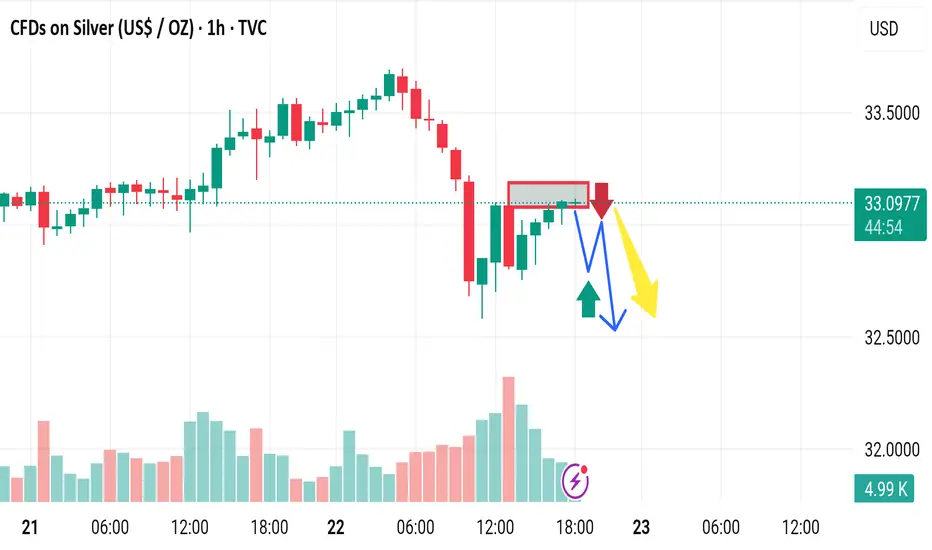
Observation: A red rectangle marks a resistance area.
Disruption: This "resistance" level is based on a short-term bounce and may not have strong historical confluence. It lacks multiple rejections to establish it as a true resistance zone.
---
2. Overemphasis on Bearish Bias
Observation: Two bearish paths (blue and yellow) dominate the projection, indicating an expected drop.
Disruption: This may be prematurely bearish. There's no confirmation of rejection yet—no strong bearish candlestick pattern (like a shooting star, engulfing, or evening star) is visible in that zone.
---
3. Lack of Bullish Consideration
Observation: A small green arrow is shown but not given much weight.
Disruption: The recent candles show higher lows, indicating potential bullish pressure. If price breaks above the marked zone, it may trigger a short squeeze rally.
---
4. Volume Misalignment
Observation: Volume spikes during the bounce, especially on the green candles.
Disruption: Rising volume on a recovery typically supports continuation upward. This analysis ignores the bullish volume context and instead forecasts reversal.
---
5. No Higher Timeframe Confluence
Observation: 1-hour chart used in isolation.
Disruption: A strong bearish or bullish direction on the 4H or Daily chart would validate or invalidate this local setup. Without it, the trade thesis lacks broader context.
Disclaimer
The information and publications are not meant to be, and do not constitute, financial, investment, trading, or other types of advice or recommendations supplied or endorsed by TradingView. Read more in the Terms of Use.
Disclaimer
The information and publications are not meant to be, and do not constitute, financial, investment, trading, or other types of advice or recommendations supplied or endorsed by TradingView. Read more in the Terms of Use.