Bearish Counter-Analysis:
1. Resistance Zone Saturation:
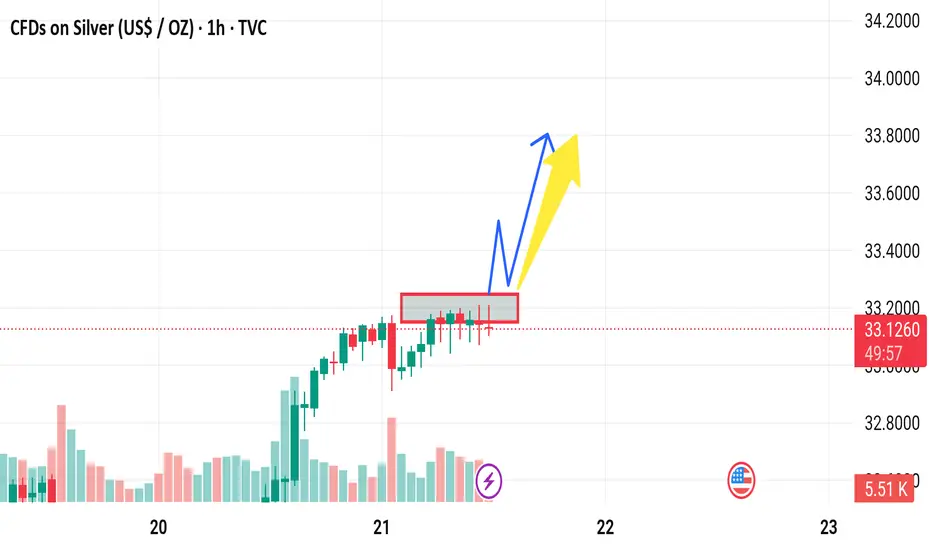
The red box shows repeated tests of the resistance area around $33.14–$33.20. This can suggest exhaustion instead of momentum.
Multiple failed attempts to break this zone can result in bearish rejection.
2. Volume Divergence:
The volume appears to be declining even as price approaches resistance. This divergence can imply a lack of buyer strength, which is a red flag for a bullish continuation.
3. Possible Bull Trap:
A sharp move above resistance followed by a quick drop back inside (false breakout) could trap long traders.
This may be followed by a sharp sell-off toward the previous support level (~$32.60–$32.80).
4. Candlestick Patterns:
Watch closely for bearish candlestick patterns like doji, shooting star, or bearish engulfing in the red box. Their appearance would strengthen a bearish reversal case.
5. MACD/RSI (if available):
If the RSI is overbought or MACD shows a bearish crossover, it would reinforce the possibility of a downward retracement.
1. Resistance Zone Saturation:
The red box shows repeated tests of the resistance area around $33.14–$33.20. This can suggest exhaustion instead of momentum.
Multiple failed attempts to break this zone can result in bearish rejection.
2. Volume Divergence:
The volume appears to be declining even as price approaches resistance. This divergence can imply a lack of buyer strength, which is a red flag for a bullish continuation.
3. Possible Bull Trap:
A sharp move above resistance followed by a quick drop back inside (false breakout) could trap long traders.
This may be followed by a sharp sell-off toward the previous support level (~$32.60–$32.80).
4. Candlestick Patterns:
Watch closely for bearish candlestick patterns like doji, shooting star, or bearish engulfing in the red box. Their appearance would strengthen a bearish reversal case.
5. MACD/RSI (if available):
If the RSI is overbought or MACD shows a bearish crossover, it would reinforce the possibility of a downward retracement.
Disclaimer
The information and publications are not meant to be, and do not constitute, financial, investment, trading, or other types of advice or recommendations supplied or endorsed by TradingView. Read more in the Terms of Use.
Disclaimer
The information and publications are not meant to be, and do not constitute, financial, investment, trading, or other types of advice or recommendations supplied or endorsed by TradingView. Read more in the Terms of Use.