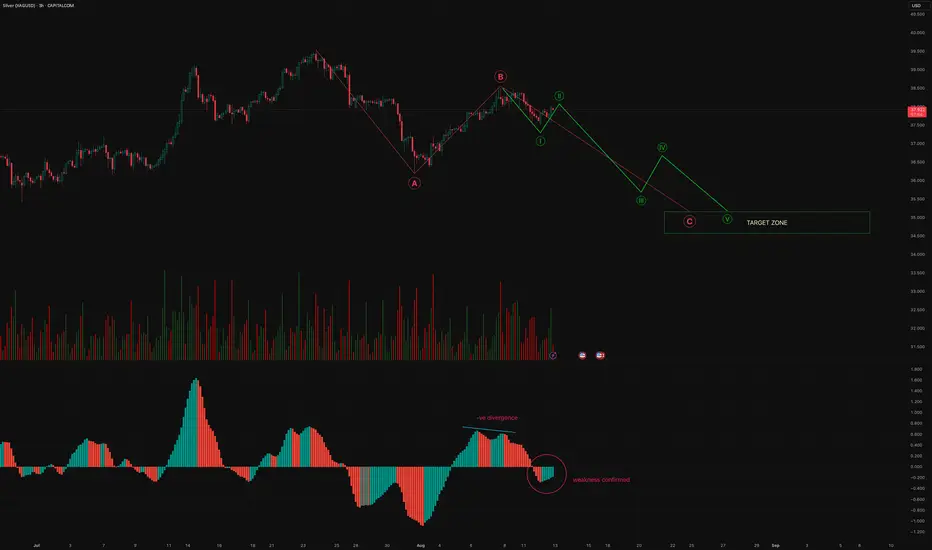
1. Current Structure – Elliott Wave Count
Wave A: A sharp decline from the recent high, establishing a strong corrective leg down.
Wave B: A retracement rally, but not breaking above the prior peak, indicating corrective behavior rather than a fresh uptrend.
Wave C (in progress): The chart is projecting a 5-wave decline inside Wave C.
Current breakdown of Wave C:
Wave ①: First leg down from the Wave B peak.
Wave ②: A small corrective bounce is expected before further downside.
Wave ③, ④, ⑤: Projected to take price lower, with the most aggressive drop likely during Wave ③.
2. AO Divergence
Negative Divergence: Price made a higher high into Wave B, but the MACD histogram made a lower high — a classic bearish divergence, signaling weakening buying momentum.
Weakness Confirmed: Histogram has crossed below the zero line, confirming bearish momentum and supporting the Elliott Wave bearish scenario.
3. Volume Profile
Selling volume during the drop from Wave B is noticeably higher than the buying volume in the prior rally — indicating stronger participation on the downside.
This supports the continuation of the bearish structure.
4. Price Projections
Based on the wave count:
Short-term: Likely a small bounce (Wave ②) towards ~$37.70–$37.90 area.
Medium-term: A sharp decline towards the $35.80–$36.00 zone in Wave ③.
Final target for Wave C: Potentially $35.20–$35.50 range before any major reversal attempt.
5. Trading Bias
Bias: Bearish
Aggressive entry: After a small corrective bounce (Wave ②) fails and momentum turns down again.
Stop-loss: Above Wave B (~$38.40).
Downside target zone: $35.20–$35.4.
6. Risk Factors
If price breaks above $38.40, the current Elliott Wave bearish count will be invalidated.
Geopolitical or macroeconomic news affecting silver demand could cause abrupt reversals.
Conclusion:
The chart shows a completed ABC correction with Wave C in progress, backed by negative divergence on the MACD histogram and confirmed momentum weakness. Expect a short-term bounce followed by a sharp decline, with a probable target in the $35.20–$35.50 range.
Disclaimer:
This analysis is for educational and informational purposes only and does not constitute financial advice, investment recommendation, or an offer to buy or sell any financial instrument. Trading in commodities, forex, stocks, or derivatives involves substantial risk and may not be suitable for all investors. Past performance is not indicative of future results. You should conduct your own research and consult with a qualified financial advisor before making any trading or investment decisions. You are solely responsible for your trading and investment outcomes.
Disclaimer
The information and publications are not meant to be, and do not constitute, financial, investment, trading, or other types of advice or recommendations supplied or endorsed by TradingView. Read more in the Terms of Use.
Disclaimer
The information and publications are not meant to be, and do not constitute, financial, investment, trading, or other types of advice or recommendations supplied or endorsed by TradingView. Read more in the Terms of Use.
