🧨 Disruption Points:
1. Overbought Condition / RSI Divergence
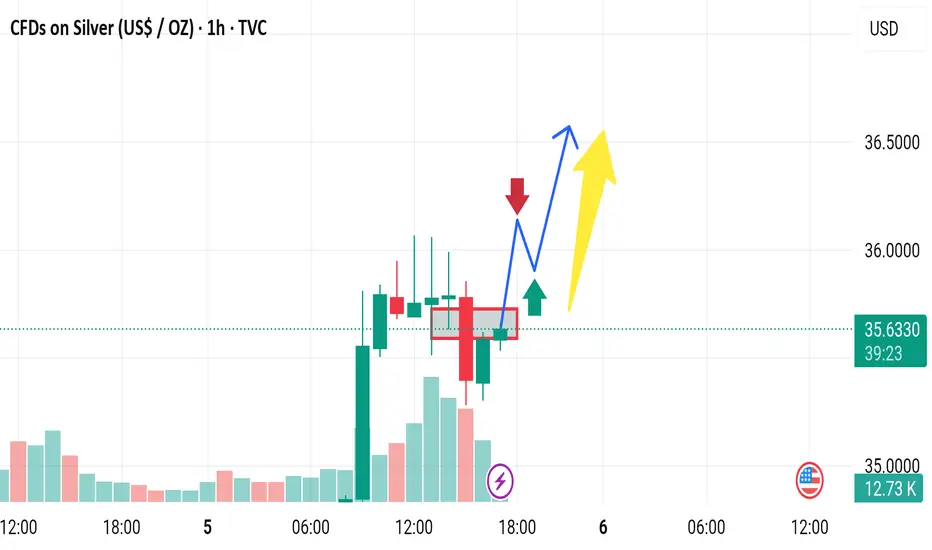
Even though the price is surging (+3.30%), there could be an overbought condition forming.
If RSI or other momentum indicators (not shown here) diverge, it might signal weakness in bullish momentum.
> Disruptive idea: Price may fake the breakout (blue arrow) and then sharply reverse, trapping late buyers.
---
2. False Breakout Trap
The red-box area could be a liquidity zone where smart money might induce a fake breakout before dumping.
> Alternative path: Price breaks above temporarily (as in blue path), but then reverses violently back into the range, forming a “bull trap.”
---
3. Volume Anomaly
The volume appears to be decreasing on recent bullish candles after the initial spike.
This suggests that the uptrend may be losing strength, making the yellow arrow scenario less likely.
> Contrary outlook: Lack of volume confirmation could mean a sideways consolidation or reversal is more probable.
1. Overbought Condition / RSI Divergence
Even though the price is surging (+3.30%), there could be an overbought condition forming.
If RSI or other momentum indicators (not shown here) diverge, it might signal weakness in bullish momentum.
> Disruptive idea: Price may fake the breakout (blue arrow) and then sharply reverse, trapping late buyers.
---
2. False Breakout Trap
The red-box area could be a liquidity zone where smart money might induce a fake breakout before dumping.
> Alternative path: Price breaks above temporarily (as in blue path), but then reverses violently back into the range, forming a “bull trap.”
---
3. Volume Anomaly
The volume appears to be decreasing on recent bullish candles after the initial spike.
This suggests that the uptrend may be losing strength, making the yellow arrow scenario less likely.
> Contrary outlook: Lack of volume confirmation could mean a sideways consolidation or reversal is more probable.
t.me/gold_free_signals1
𝙁𝙤𝙧𝙚𝙭 𝙩𝙧𝙖𝙙𝙞𝙣𝙜 𝙚𝙭𝙥𝙚𝙧𝙞𝙚𝙣𝙘𝙚 𝙩𝙚𝙖𝙢 ☺️ 𝙢𝙖𝙣𝙖𝙜𝙚 𝙮𝙤𝙪𝙧 𝙖𝙘𝙘𝙤𝙪𝙣𝙩 𝙢𝙖𝙠𝙞𝙣𝙜 𝙢𝙤𝙣𝙚𝙮 🤑💰
t.me/gold_free_signals1
𝙁𝙤𝙧𝙚𝙭 𝙩𝙧𝙖𝙙𝙞𝙣𝙜 𝙚𝙭𝙥𝙚𝙧𝙞𝙚𝙣𝙘𝙚 𝙩𝙚𝙖𝙢 ☺️ 𝙢𝙖𝙣𝙖𝙜𝙚 𝙮𝙤𝙪𝙧 𝙖𝙘𝙘𝙤𝙪𝙣𝙩 𝙢𝙖𝙠𝙞𝙣𝙜 𝙢𝙤𝙣𝙚𝙮 🤑💰
t.me/gold_free_signals1
Disclaimer
The information and publications are not meant to be, and do not constitute, financial, investment, trading, or other types of advice or recommendations supplied or endorsed by TradingView. Read more in the Terms of Use.
t.me/gold_free_signals1
𝙁𝙤𝙧𝙚𝙭 𝙩𝙧𝙖𝙙𝙞𝙣𝙜 𝙚𝙭𝙥𝙚𝙧𝙞𝙚𝙣𝙘𝙚 𝙩𝙚𝙖𝙢 ☺️ 𝙢𝙖𝙣𝙖𝙜𝙚 𝙮𝙤𝙪𝙧 𝙖𝙘𝙘𝙤𝙪𝙣𝙩 𝙢𝙖𝙠𝙞𝙣𝙜 𝙢𝙤𝙣𝙚𝙮 🤑💰
t.me/gold_free_signals1
𝙁𝙤𝙧𝙚𝙭 𝙩𝙧𝙖𝙙𝙞𝙣𝙜 𝙚𝙭𝙥𝙚𝙧𝙞𝙚𝙣𝙘𝙚 𝙩𝙚𝙖𝙢 ☺️ 𝙢𝙖𝙣𝙖𝙜𝙚 𝙮𝙤𝙪𝙧 𝙖𝙘𝙘𝙤𝙪𝙣𝙩 𝙢𝙖𝙠𝙞𝙣𝙜 𝙢𝙤𝙣𝙚𝙮 🤑💰
t.me/gold_free_signals1
Disclaimer
The information and publications are not meant to be, and do not constitute, financial, investment, trading, or other types of advice or recommendations supplied or endorsed by TradingView. Read more in the Terms of Use.