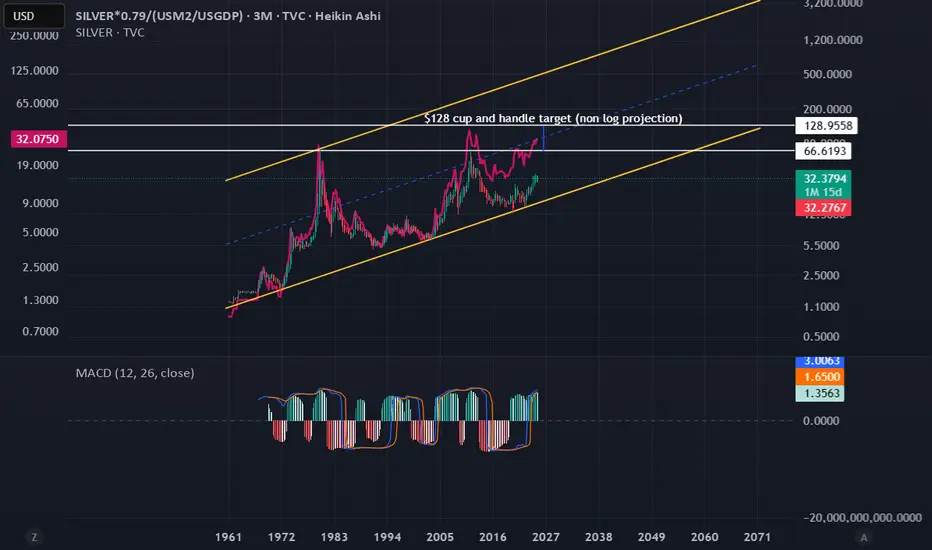
We see here a parallel log channel of silver / (USM2 / USGDP), which is silver's spread over the ratio of excess M2 to GDP.
So as M2 grows over GDP and there is excess liquidity, silver becomes cheaper. As M2 shrinks relative to GDP, silver is more expensive.
The cup and handle calculated non-LOG gives a $67 breakout target and target of $128.
Or we could follow the doldrums again and head back down to the bottom channel, yet these prices are the ratio of silver to excess m2, not nominal.
If we overlay the LOG of silver and line it up, we see a discrepancy as silver should be around $89 using the spread chart. Indicating it is significantly undervalued relative to its nominal price as a proportion of excess M2.
Disclaimer
The information and publications are not meant to be, and do not constitute, financial, investment, trading, or other types of advice or recommendations supplied or endorsed by TradingView. Read more in the Terms of Use.
Disclaimer
The information and publications are not meant to be, and do not constitute, financial, investment, trading, or other types of advice or recommendations supplied or endorsed by TradingView. Read more in the Terms of Use.