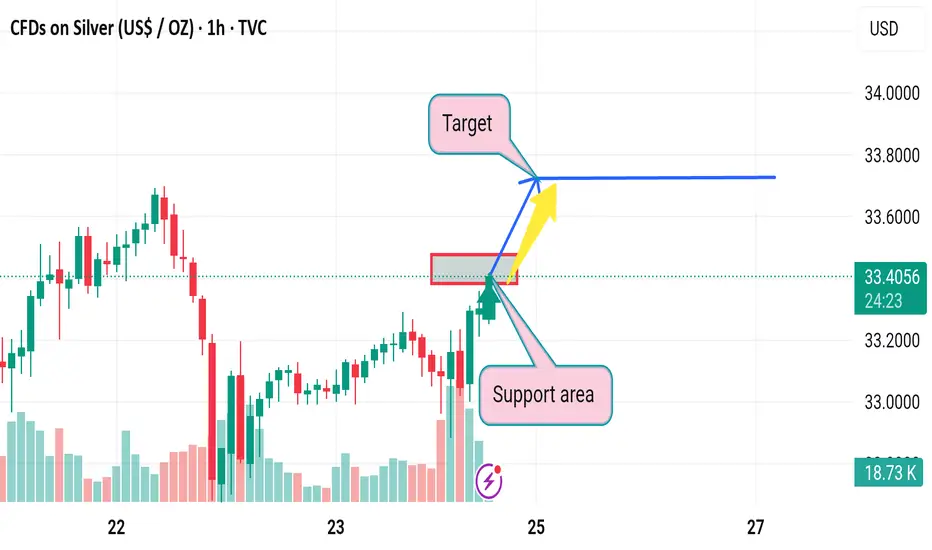
1. Mislabeling of Support Area
The red box is labeled as a support area, but price is approaching from below, not above—so technically, this should be called a resistance area.
Until price closes above it with volume, it cannot be assumed to act as support.
---
2. Volume Misinterpretation
The volume does not strongly support a breakout. The latest green bars are not significantly larger than prior volume, implying limited bullish conviction.
Lack of volume surge through resistance is often a false breakout indicator.
---
3. Single Scenario Bias
The analysis shows only an upside (bullish) projection, ignoring bearish possibilities.
If price gets rejected from resistance, there’s a strong chance of a pullback to $33.00 or lower, especially with weak momentum.
---
4. No Confirmation Indicators
The chart lacks confirming technical indicators like RSI, MACD, or trendlines to validate the bullish scenario.
Price could be forming a lower high, indicating a possible continuation of the downtrend.
Disclaimer
The information and publications are not meant to be, and do not constitute, financial, investment, trading, or other types of advice or recommendations supplied or endorsed by TradingView. Read more in the Terms of Use.
Disclaimer
The information and publications are not meant to be, and do not constitute, financial, investment, trading, or other types of advice or recommendations supplied or endorsed by TradingView. Read more in the Terms of Use.