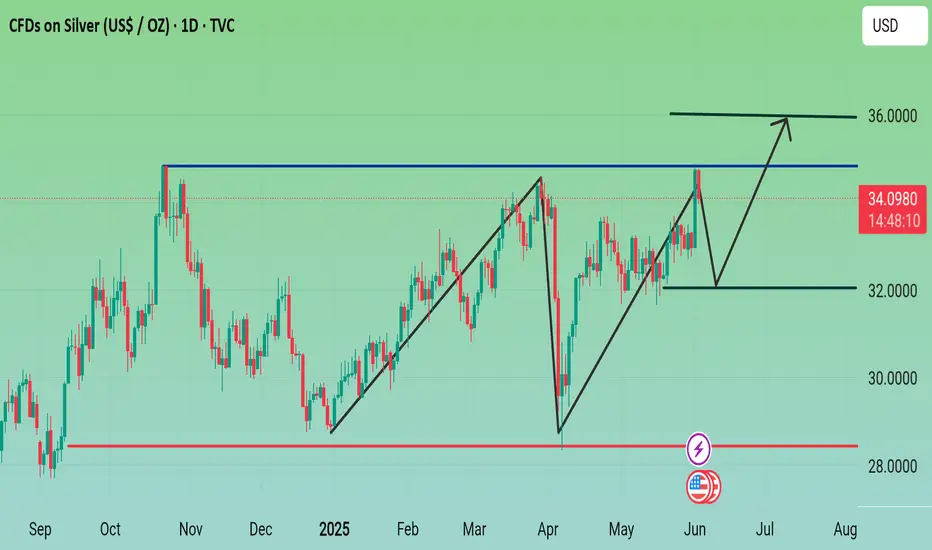
With that said, the next resistance for XAG/USD would be last year’s peak. A breach of the latter will expose the $35.00 level, followed by the February 29, 2012 high of $37.49. Conversely, if XAG/USD drops below the March 28 peak of $34.58, a decline towards $34.00 is likely. In the event of further weakness, the next support level would be the May 22 peak, which has since turned into support at $33.69.
Related publications
Disclaimer
The information and publications are not meant to be, and do not constitute, financial, investment, trading, or other types of advice or recommendations supplied or endorsed by TradingView. Read more in the Terms of Use.
Related publications
Disclaimer
The information and publications are not meant to be, and do not constitute, financial, investment, trading, or other types of advice or recommendations supplied or endorsed by TradingView. Read more in the Terms of Use.