Nifty Silver BeES – RSI Strategy & Quick Analysis
I wanted to share this Nifty Silver BeES chart with you all, purely for learning and discussion. By studying this chart, you might find some useful insights to sharpen your own analysis.
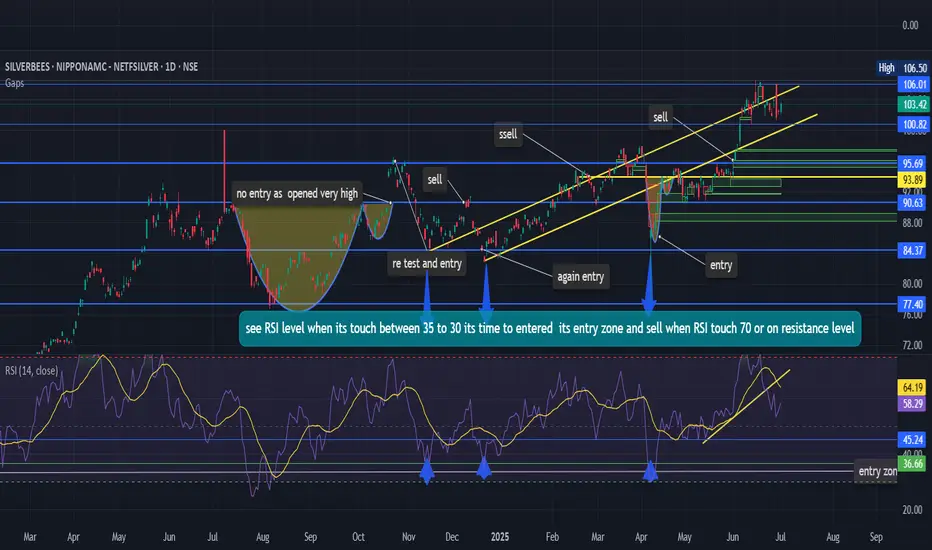
One of the key things here is the RSI (Relative Strength Index) — it plays a major role in identifying potential entry and exit zones:
✅ Entry Zone: Whenever the RSI drops into the 30–35 range, it often signals a good buying opportunity. Historically, we tend to see a decent upward move from this zone.
🚩 Exit Zone: When the RSI approaches 70 or higher — especially near resistance levels — that’s usually a signal to start selling or at least tightening stops.
That said, patience is absolutely crucial with this approach. Sometimes profit booking can take a while, and at other times, it could be as quick as “buy and get out.” It all depends on how the market behaves on that particular day.
If you find this chart interesting, do let me know. And if you spot any ways to improve this strategy or add more depth to the analysis, I’d love to hear your thoughts!
By the way, targeting a quick 2–4% profit often works quite well with this method, provided you stick to your plan and manage risk carefully.
I wanted to share this Nifty Silver BeES chart with you all, purely for learning and discussion. By studying this chart, you might find some useful insights to sharpen your own analysis.
One of the key things here is the RSI (Relative Strength Index) — it plays a major role in identifying potential entry and exit zones:
✅ Entry Zone: Whenever the RSI drops into the 30–35 range, it often signals a good buying opportunity. Historically, we tend to see a decent upward move from this zone.
🚩 Exit Zone: When the RSI approaches 70 or higher — especially near resistance levels — that’s usually a signal to start selling or at least tightening stops.
That said, patience is absolutely crucial with this approach. Sometimes profit booking can take a while, and at other times, it could be as quick as “buy and get out.” It all depends on how the market behaves on that particular day.
If you find this chart interesting, do let me know. And if you spot any ways to improve this strategy or add more depth to the analysis, I’d love to hear your thoughts!
By the way, targeting a quick 2–4% profit often works quite well with this method, provided you stick to your plan and manage risk carefully.
Disclaimer
The information and publications are not meant to be, and do not constitute, financial, investment, trading, or other types of advice or recommendations supplied or endorsed by TradingView. Read more in the Terms of Use.
Disclaimer
The information and publications are not meant to be, and do not constitute, financial, investment, trading, or other types of advice or recommendations supplied or endorsed by TradingView. Read more in the Terms of Use.