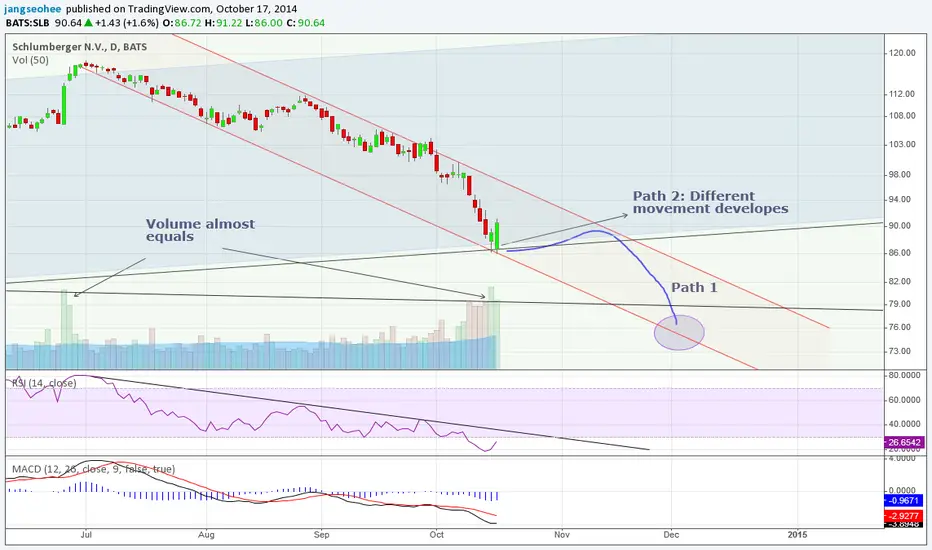
On a daily chart, the price is flowing down in the smooth thin downtrend channel. And it seems to have found
support temporarily. Besides, the distribution volume at the blue channel top seems to have been offset by the accumulation volume!
If there is another leg of sell-off which i label-Path 1, the next potential target price could be about 75 depending on how price movement develops.
If the price finally break out of this downtrend channel, then path 2 would be different story.
Look out for the RSI downtrend line!
Related publications
Disclaimer
The information and publications are not meant to be, and do not constitute, financial, investment, trading, or other types of advice or recommendations supplied or endorsed by TradingView. Read more in the Terms of Use.
Related publications
Disclaimer
The information and publications are not meant to be, and do not constitute, financial, investment, trading, or other types of advice or recommendations supplied or endorsed by TradingView. Read more in the Terms of Use.