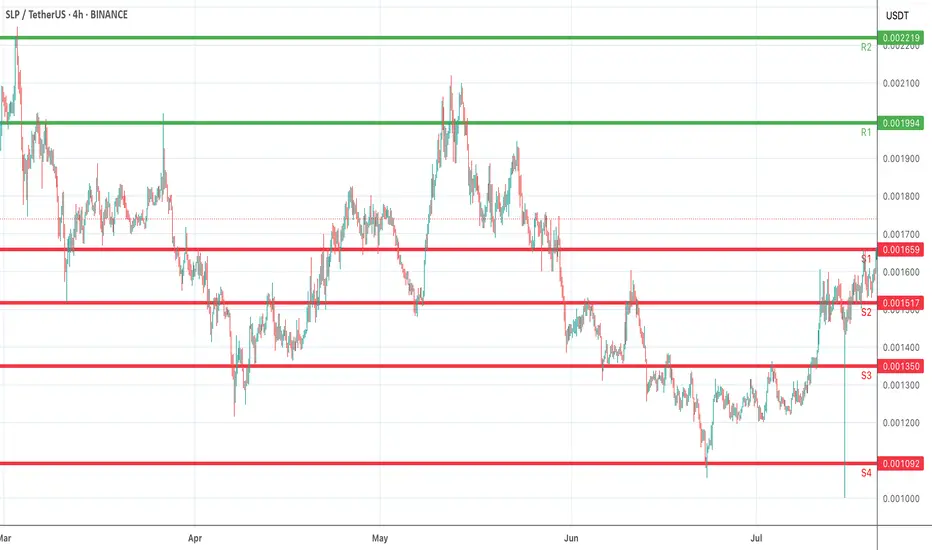
The chart highlights well-defined support and resistance levels. On the downside, S1 (0.001659) and S2 (0.001517) serve as near-term support zones where buyers may look to defend. Further downside risk could extend toward S3 (0.001350) and S4 (0.001092) if momentum weakens. On the upside, R1 (0.001994) and R2 (0.002219) act as resistance barriers, where selling pressure or profit-taking may emerge.
Trading within this range, a breakout above R1 could open the path to bullish continuation, while a breakdown below S2 may trigger extended bearish pressure. Monitoring volume and candle closes around these key zones will provide stronger confirmation for directional bias.
Trading within this range, a breakout above R1 could open the path to bullish continuation, while a breakdown below S2 may trigger extended bearish pressure. Monitoring volume and candle closes around these key zones will provide stronger confirmation for directional bias.
Disclaimer
The information and publications are not meant to be, and do not constitute, financial, investment, trading, or other types of advice or recommendations supplied or endorsed by TradingView. Read more in the Terms of Use.
Disclaimer
The information and publications are not meant to be, and do not constitute, financial, investment, trading, or other types of advice or recommendations supplied or endorsed by TradingView. Read more in the Terms of Use.