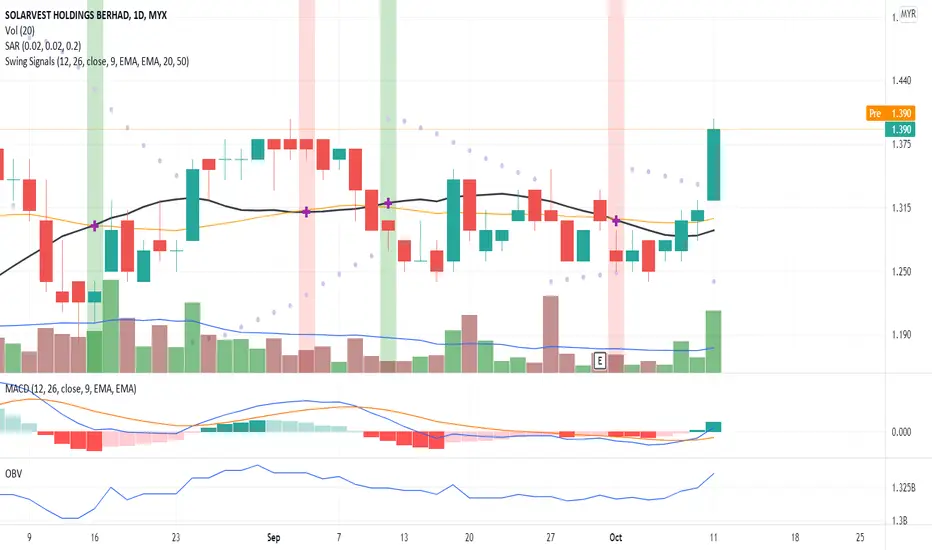
The candlestick shows a breakout (BO) signal due to significant price movement where the volume is above MA20. MACD and OBV charts indicate a divergence signal. Hence, high possibility of an uptrend pattern. Put SLVEST in your WL and watch out for significant price movement with volume to support the uptrend.
R 1.450
S 1.310
R 1.450
S 1.310
Disclaimer
The information and publications are not meant to be, and do not constitute, financial, investment, trading, or other types of advice or recommendations supplied or endorsed by TradingView. Read more in the Terms of Use.
Disclaimer
The information and publications are not meant to be, and do not constitute, financial, investment, trading, or other types of advice or recommendations supplied or endorsed by TradingView. Read more in the Terms of Use.