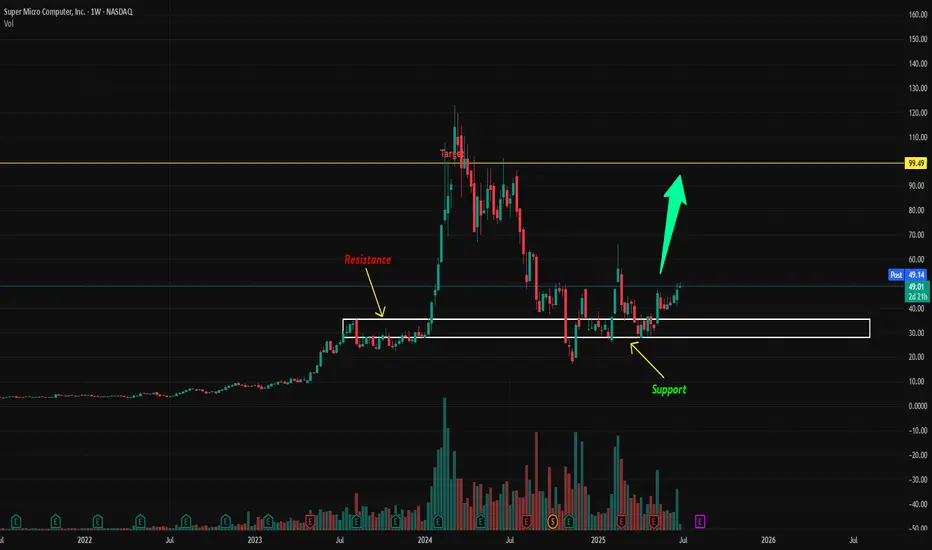
Sometimes it pays well to look at a weekly charts as they give opportunities for a very large moves and potential for massive gains. In this example, SMCI is such a stock. The stock first broke out of resistance zone, white rectangle, and made a strong push into 100s. It then retraced the move back into the rectangle zone, but in this instance, the resistance turned into support. It is these zones that act as support/resistance are the powerful levels. Since the support held, it can easily move back into the $99 or so to re-test those highs again, a potential 100% upside.
Disclaimer
The information and publications are not meant to be, and do not constitute, financial, investment, trading, or other types of advice or recommendations supplied or endorsed by TradingView. Read more in the Terms of Use.
Disclaimer
The information and publications are not meant to be, and do not constitute, financial, investment, trading, or other types of advice or recommendations supplied or endorsed by TradingView. Read more in the Terms of Use.