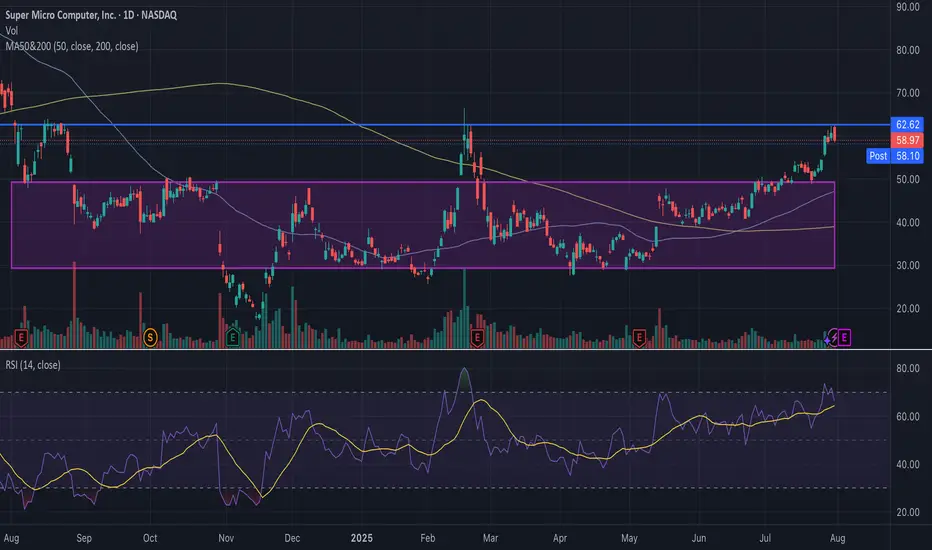
SMCI is currently struggling to break past a key historical trend line around $62–$63, a level that acted as resistance multiple times over the past year. The stock briefly broke above $60, but failed to hold the breakout, signaling potential exhaustion. Price is approaching overbought territory with RSI nearing 70. This move is also extended from both the 50-day (blue) and 200-day (yellow) moving averages. Additionally, volume was not exceedingly high during the breakout. I have strong conviction that it will drop to ~50. SMCI spent nearly 9 months trading between ~$33 and ~$50, as shown in the purple consolidation box. If this breakout fails, $50 becomes a natural target, as its the resistance line in the consolidation box where SMCI has been trading at for 9 months. A close below $58 (today’s low) would confirm rejection and likely accelerate selling. A put position could be highly profitable.
Disclaimer
The information and publications are not meant to be, and do not constitute, financial, investment, trading, or other types of advice or recommendations supplied or endorsed by TradingView. Read more in the Terms of Use.
Disclaimer
The information and publications are not meant to be, and do not constitute, financial, investment, trading, or other types of advice or recommendations supplied or endorsed by TradingView. Read more in the Terms of Use.