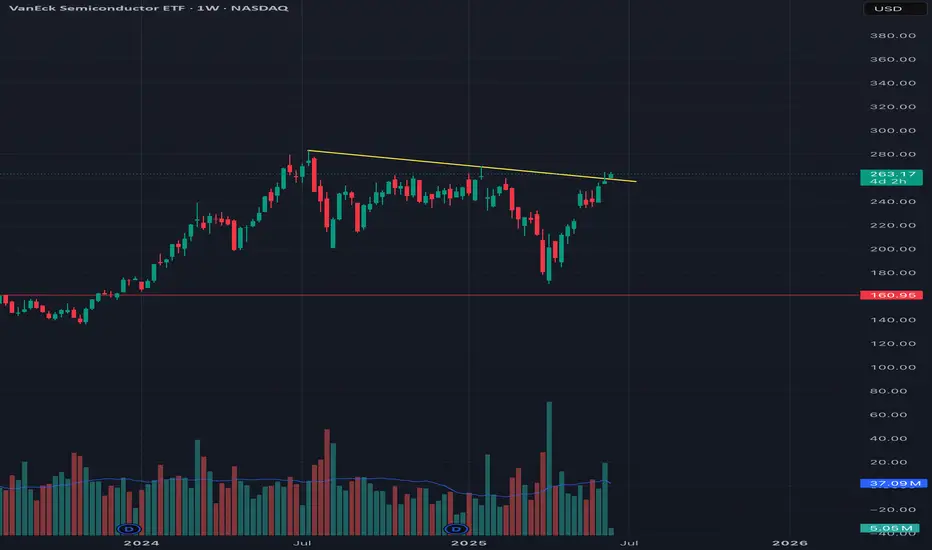
As you can see from this weekly chart, the semiconductors have tried three different times to get above this trend line and have gotten rejected all three times. Could it go higher from here? Of course it could, but you have to ask yourself what are the probabilities that it will continue to go up through all this heavy resistance? Not very good is the answer. A close above last weeks candle would confirm a breakout, otherwise, bearish view remains intact.
Trade active
SMH just printed a topping tail on the daily chart. We now have a topping tail on the daily chart in addtion to the topping tail on the weekly chart as well as this area being a golden pocket retracement zone. So many factors pointing to a move back down to the bottom of the fib level around $172. If it goes lower than that, I am expecting a drop to the bottom of a Major weekly upward slopping channel around $125.
Trade closed: target reached
Edit: not a golden pocket retracement zone, I got this confused with IWM, nonetheless, still looking for a move down. Note
So today you can see on the daily chart that the SMH has broken down outside of the bearish wedge, in addition to that, we had a second topping tail in a row on the weekly timeframe. So many factors here screaming that the Semiconductors have topped, Institutions are definitely unloading into retail.
Note
Strong move up above the 2 previous topping tails and trendline. Trade closed. This is a good signal to pivot and go long Semis
Disclaimer
The information and publications are not meant to be, and do not constitute, financial, investment, trading, or other types of advice or recommendations supplied or endorsed by TradingView. Read more in the Terms of Use.
Disclaimer
The information and publications are not meant to be, and do not constitute, financial, investment, trading, or other types of advice or recommendations supplied or endorsed by TradingView. Read more in the Terms of Use.