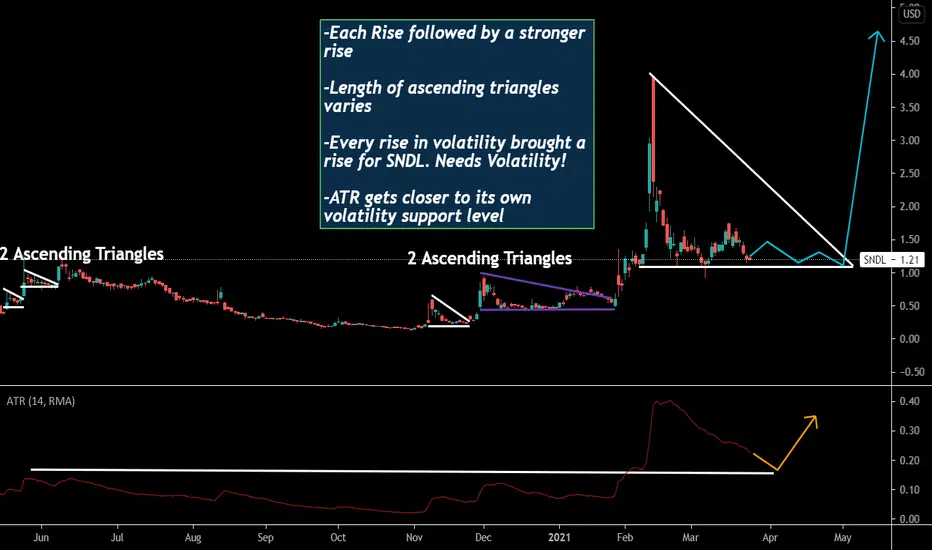
On this analysis, we can clearly see the repeating patterns that SNDL been forming on its chart.
-It is pretty clear how SNDL is in love with the Ascending Triangles.
-While some triangles took days till the breakout (rise), some took months (purple triangle). So it really depends on market sentiment and investor's confidence.
-The recent big rise again followed by a nice drop which brought the potential for another Ascending Triangle formation.
-Another fact about the patterns is that every rise was followed by a bigger rise! But also every drop was bigger (in percentage) than the previous drop.
For ex: While the first 2 drops were 24% and 40% big, the next 2 ascendings had a drop of 60% and 50%. And lastly, the recent drop was 70%. So each time,
the returns are bigger, but the risks are getting bigger too!
-Currently, the length of the triangle is 1 month and 14 days. The longest time it took to break the triangle (purple triangle) was 2 months. Looks like we are going
for the 2 months long triangle formation again!
-With the given lost confidence among investors due to the market volatility and rising bonds, it is more probable that SNDL will wait for couple more weeks to fill the 2 months period for another breakout and rise.
-ATR is also getting close to its Volatility support level, but still has some space to drop. Probably will cause a little more drop in SNDL price as well.
Disclaimer
The information and publications are not meant to be, and do not constitute, financial, investment, trading, or other types of advice or recommendations supplied or endorsed by TradingView. Read more in the Terms of Use.
Disclaimer
The information and publications are not meant to be, and do not constitute, financial, investment, trading, or other types of advice or recommendations supplied or endorsed by TradingView. Read more in the Terms of Use.