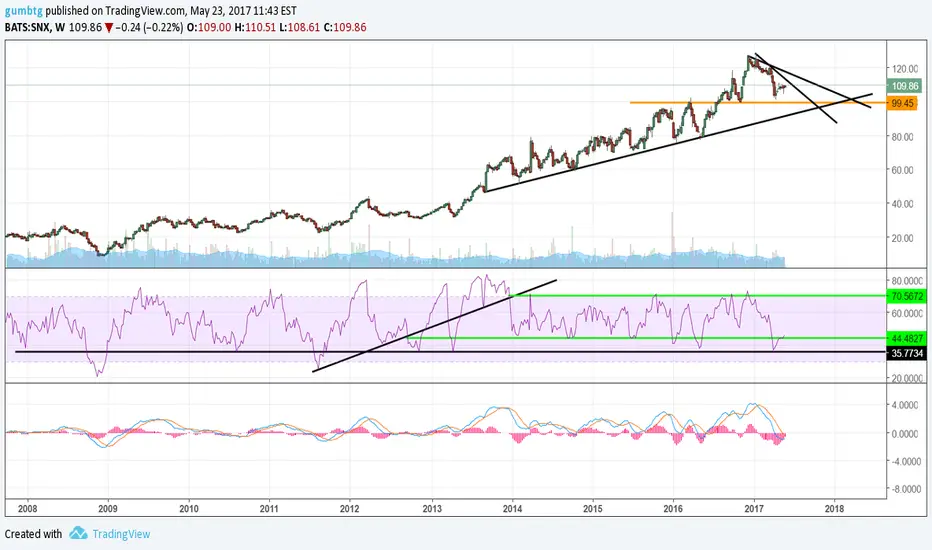
Not Sure what to make of the chart. RSI and MACD telling the most.
Please comment on my two black trendlines from the recent peak. Wasn't sure what to do there. Drew two, one from intraday high and the other from closing high.
Watch that orange support line
Please comment on my two black trendlines from the recent peak. Wasn't sure what to do there. Drew two, one from intraday high and the other from closing high.
Watch that orange support line
-If you find this idea interesting please leave a like
-Follow for more
-Comments are always welcomed and appreciated
-Follow for more
-Comments are always welcomed and appreciated
Disclaimer
The information and publications are not meant to be, and do not constitute, financial, investment, trading, or other types of advice or recommendations supplied or endorsed by TradingView. Read more in the Terms of Use.