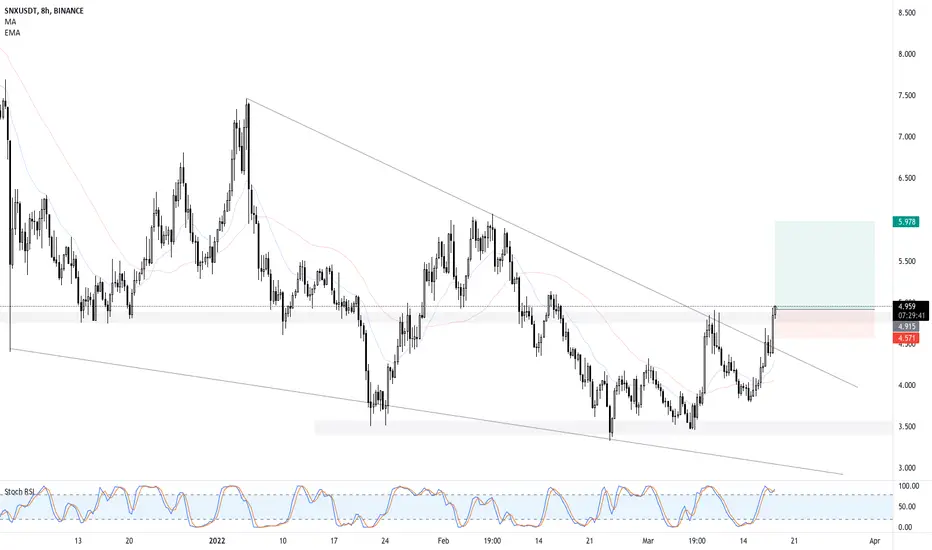
Price is in a falling wedge, a bullish indication. We are currently breaking that wedge and a resistance zone on the daily chart. After forming a rounding pattern on the 4h chart, price broke thru a potential double top pattern with a high volume breakout candle. Total market making a run to the upside following a break of a bullish flag on the total index chart
Disclaimer
The information and publications are not meant to be, and do not constitute, financial, investment, trading, or other types of advice or recommendations supplied or endorsed by TradingView. Read more in the Terms of Use.
Disclaimer
The information and publications are not meant to be, and do not constitute, financial, investment, trading, or other types of advice or recommendations supplied or endorsed by TradingView. Read more in the Terms of Use.