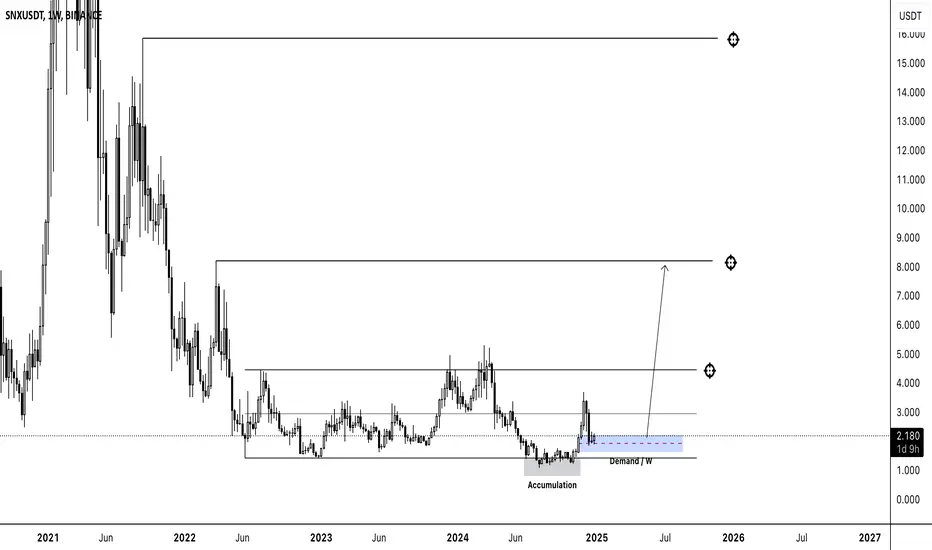
The Accumulation Phase (2023-2024) is marked on the chart, showing a period of consolidation where price moves within a range. This phase indicates that buyers and sellers are reaching equilibrium, setting up a strong foundation for future price movement.
The Demand Zone (2025) is represented by the blue dashed area, a key level of support where price could experience a bounce. This zone is crucial as it could offer an entry point for long trades before a potential breakout.
The chart projects a Bullish Breakout (2025 and beyond), where the price is expected to rise significantly after the accumulation phase.
Potential Target: The price is projected to rise significantly after the breakout, potentially reaching targets as high as $16 based on the breakout from the demand zone.
Overall Outlook: The chart suggests a well-planned accumulation phase with a likely bullish breakout in 2025. Keep an eye on the demand area for potential entries and watch for upward momentum as price breaks above key resistance levels.
💎💎- Professional Trader
💎💎 - Discord: discord.gg/gHKNVMyEvd
💎💎 - Trading Course: liquiditysweep369.carrd.co/
💎💎 - Discord: discord.gg/gHKNVMyEvd
💎💎 - Trading Course: liquiditysweep369.carrd.co/
Disclaimer
The information and publications are not meant to be, and do not constitute, financial, investment, trading, or other types of advice or recommendations supplied or endorsed by TradingView. Read more in the Terms of Use.