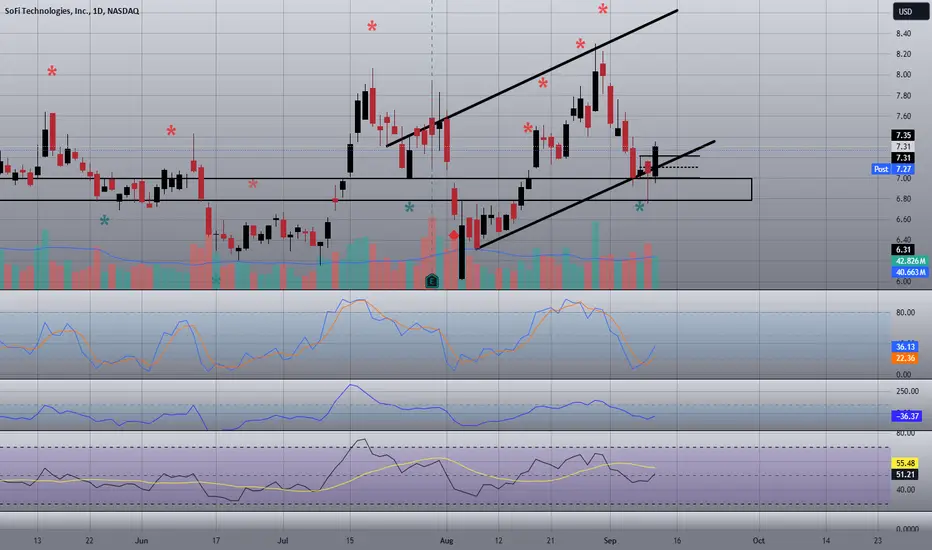
SOFI appears to be at the bottom of and upward parallel channel also with a bullish candle on the key level. It also has OK RSI and SRSI readings. There is a possibility it may cycle up.
Disclaimer
The information and publications are not meant to be, and do not constitute, financial, investment, trading, or other types of advice or recommendations supplied or endorsed by TradingView. Read more in the Terms of Use.
Disclaimer
The information and publications are not meant to be, and do not constitute, financial, investment, trading, or other types of advice or recommendations supplied or endorsed by TradingView. Read more in the Terms of Use.