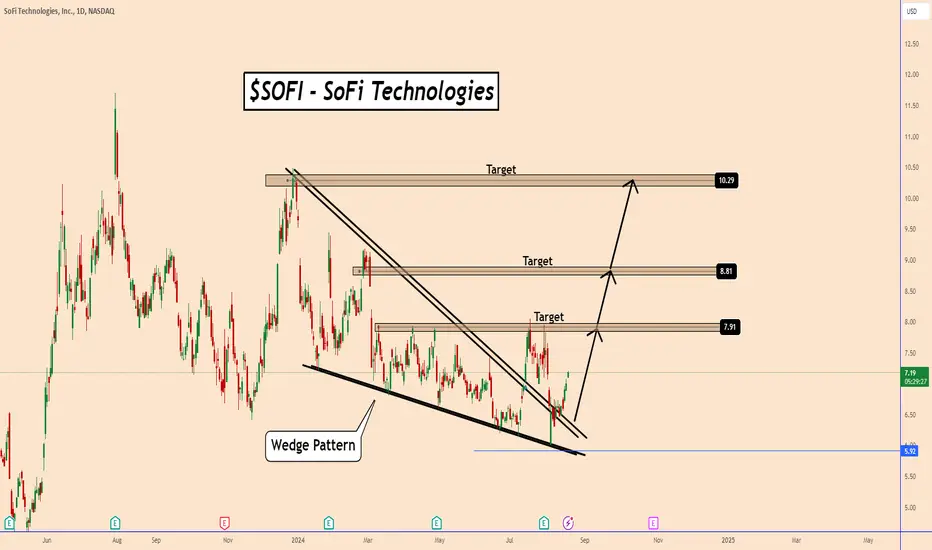
SOFI: Bullish Wedge pattern indicating further upside
Price broke out from a bullish wedge pattern and this is indicating further upside.
After all the market crashed at the beginning of August we can see that SOFI is still holding well the bullish momentum.
During the previous quarters, SOFI reported very good data and also on 30-July-2024 SOFI reported good ER data again. So the company is performing well overall.
We can see SOFI to reach 8.80 and 10.2 price areas easily.
You may find more details in the chart!
Thank you and Good Luck!
❤️PS: Please support with a like or comment if you find this analysis useful for your trading day❤️
Trade closed: target reached
✅MY Free Signals
t.me/TradingPuzzles
✅Personal Telegram
t.me/KlejdiCuni
✅YouTube
youtube.com/@TradingPuzzles
✅MY Recommended Broker is TRADE NATION
🔸bit.ly/49VySJF
t.me/TradingPuzzles
✅Personal Telegram
t.me/KlejdiCuni
✅YouTube
youtube.com/@TradingPuzzles
✅MY Recommended Broker is TRADE NATION
🔸bit.ly/49VySJF
Disclaimer
The information and publications are not meant to be, and do not constitute, financial, investment, trading, or other types of advice or recommendations supplied or endorsed by TradingView. Read more in the Terms of Use.