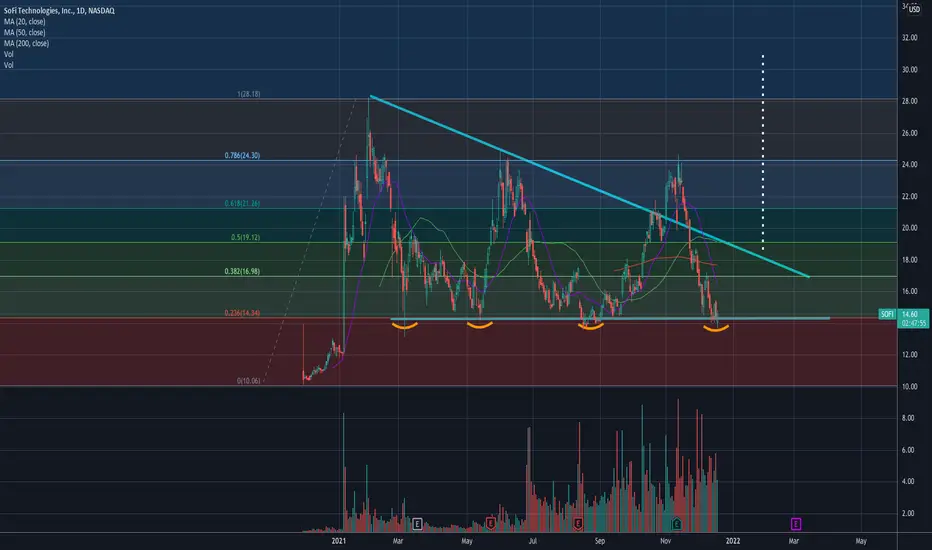
Sofi has been testing the lower trend line inside a descending triangle. It has successfully held and bounced from that trend line 3 times prior and is expect to do so again.
Target 1 - $16.98
Target 2 - $19.12
Target 3 - $30
Risk - Price fall below $14.
———————————————————
How to read my charts?
- Matching color trend lines shows the pattern. Sometimes a chart can have multiple patterns. Each pattern will have matching color trend lines.
- The yellow horizontal lines shows support and resistance areas.
- Fib lines also shows support and resistance areas.
- The dotted white lines shows price projection for breakout or breakdown target.
Disclaimer: Do your own DD. Not an investment advice.
I am not a licensed professional. None of the posts that I published are investment advice. Do your own research.
Disclaimer
The information and publications are not meant to be, and do not constitute, financial, investment, trading, or other types of advice or recommendations supplied or endorsed by TradingView. Read more in the Terms of Use.