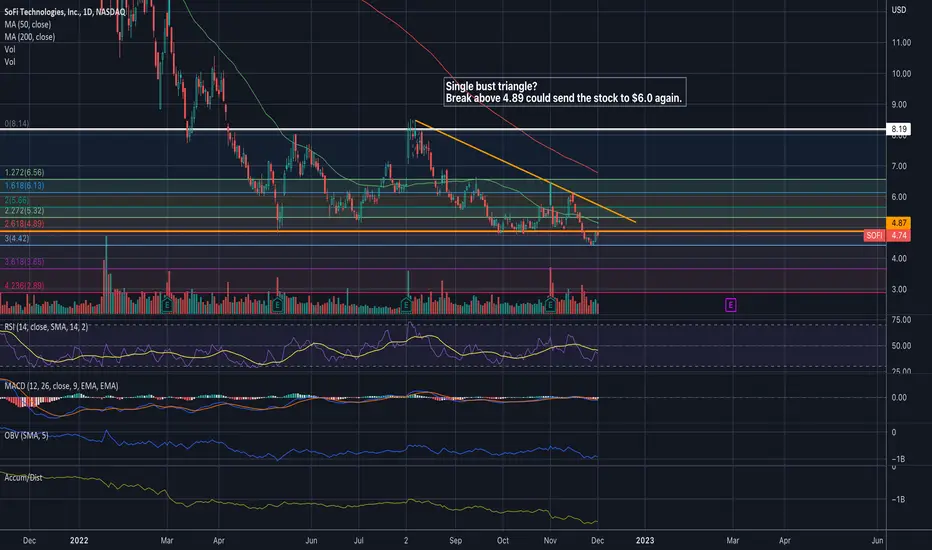
In earlier post this morning, I miss identified the pattern as "diving board pattern". To qualify as diving board pattern the price has to drop at least 20% from the orange base line. The price declined only about 9%. So single bust descending triangle seems a better fit.
Theoretically if the price can break above the triangle base line we should see price break above $6.0 and ultimately get to $8.
Given the market condition and student loan head winds, $8 seems impossible.
Target 1 - $5.30
Target 2 - $5.65
Target 3 - $6.0
Stop loss - $4.42 and below
Risk - falling to back to $4.42 and $3.65 in worst case.
——
Trade is done when it hit one of the target or stop loss is hit.
Disclaimer: Personal trading note. Not an investment advice.
I am not a licensed professional. None of the posts that I published are investment advice. Do your own research.
Disclaimer
The information and publications are not meant to be, and do not constitute, financial, investment, trading, or other types of advice or recommendations supplied or endorsed by TradingView. Read more in the Terms of Use.