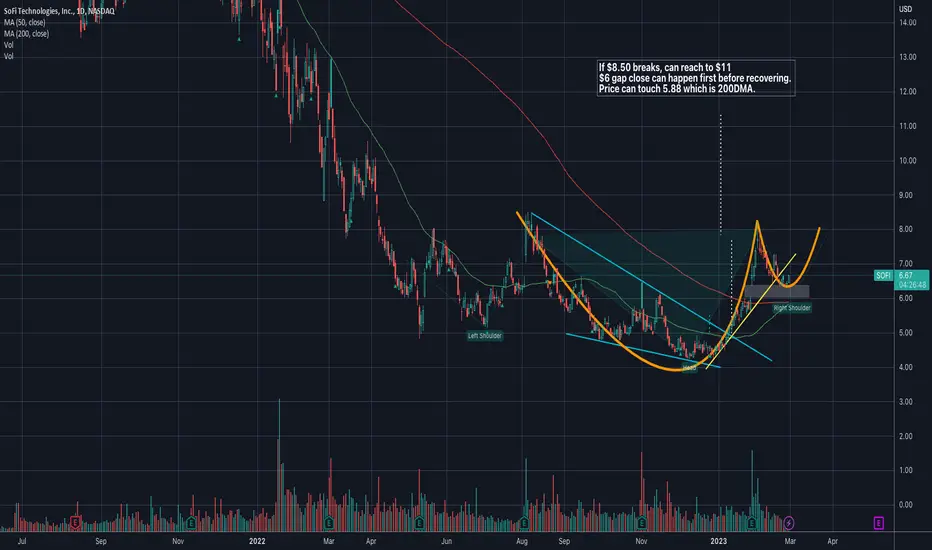
The gap below looks like it could fill but SOFI has resisted so far to fill it. If you are a bull you might be tempted to see two-in-one pattern.
1. Inverse head and shoulder (right shoulder has yet to be complete of course)
2. Cup and handle (handle has yet to be complete.)
If both pattern validates. Meaning price clime above the neck line around$8.50, it could have further upside to $11.
But frequently, the pattern can fail before validation.
How would you position? Bullish or bearish?
------------------------
Not an investment advice.
I am not a licensed professional. None of the posts that I published are investment advice. Do your own research.
Disclaimer
The information and publications are not meant to be, and do not constitute, financial, investment, trading, or other types of advice or recommendations supplied or endorsed by TradingView. Read more in the Terms of Use.