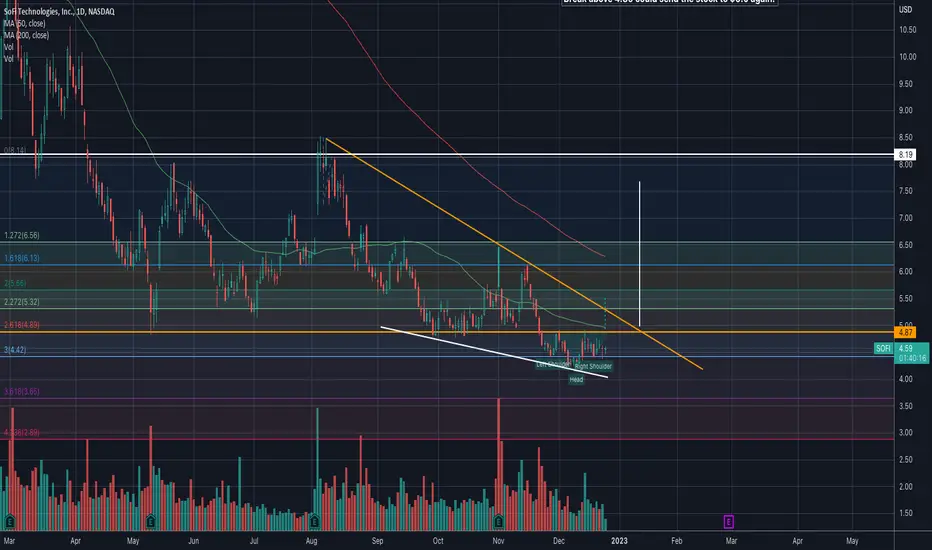
#SOFI Looks like the bottom is in. The stock is forming a mini inverse head and shoulder.
If the neck line break at $4.89 it could reach to $5.50 area.
Target 1 - $4.89
Target 2 - $5.50
Target 3 - $7.50 (longer term multi months.)
Risk - a fall to $3.65
——
Trade is done when it hit one of the target or stop loss is hit.
Disclaimer: Trading note. Not an investment advice.
If the neck line break at $4.89 it could reach to $5.50 area.
Target 1 - $4.89
Target 2 - $5.50
Target 3 - $7.50 (longer term multi months.)
Risk - a fall to $3.65
——
Trade is done when it hit one of the target or stop loss is hit.
Disclaimer: Trading note. Not an investment advice.
I am not a licensed professional. None of the posts that I published are investment advice. Do your own research.
Disclaimer
The information and publications are not meant to be, and do not constitute, financial, investment, trading, or other types of advice or recommendations supplied or endorsed by TradingView. Read more in the Terms of Use.