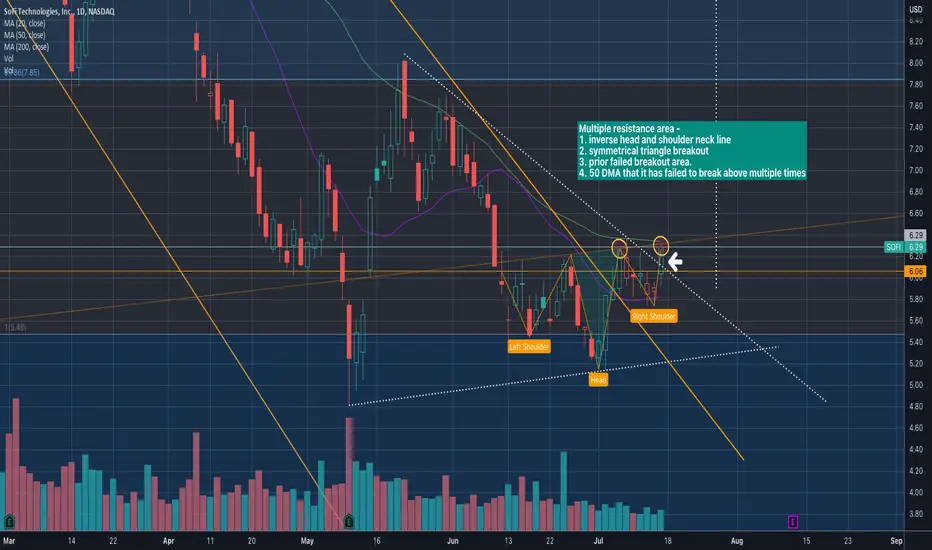
Even though SOFI broke out of the falling wedge it is currently at the junction of multiple resistance area.
1. inverse head and shoulder neck line
2. symmetrical triangle breakout
3. prior failed breakout area.
4. 50 DMA that it has failed to break above multiple times
The company came out with S3 filing for $1 Billion shelf offering and recent reverse split power given to the board is going to act as tremendous head wind to the stock price at this juncture. Bad timing.
If the price break above $6.40 and trade above that price level for 3 days, it would be bullish. Otherwise we could see it retrace back to $5.79 - $5.30 area.
It will all depend on whether the investors can shake off the shelf offering news. Frustrating time for investors.
------------------------------------
Not an investment advice. Your trading decisions are your own responsibility.
I am not a licensed professional. None of the posts that I published are investment advice. Do your own research.
Disclaimer
The information and publications are not meant to be, and do not constitute, financial, investment, trading, or other types of advice or recommendations supplied or endorsed by TradingView. Read more in the Terms of Use.