After clearing over 100 lines off my chart, I wanted to take a clean, fresh look at SoFi heading into the upcoming earnings report — just to gain a new perspective on where we stand.
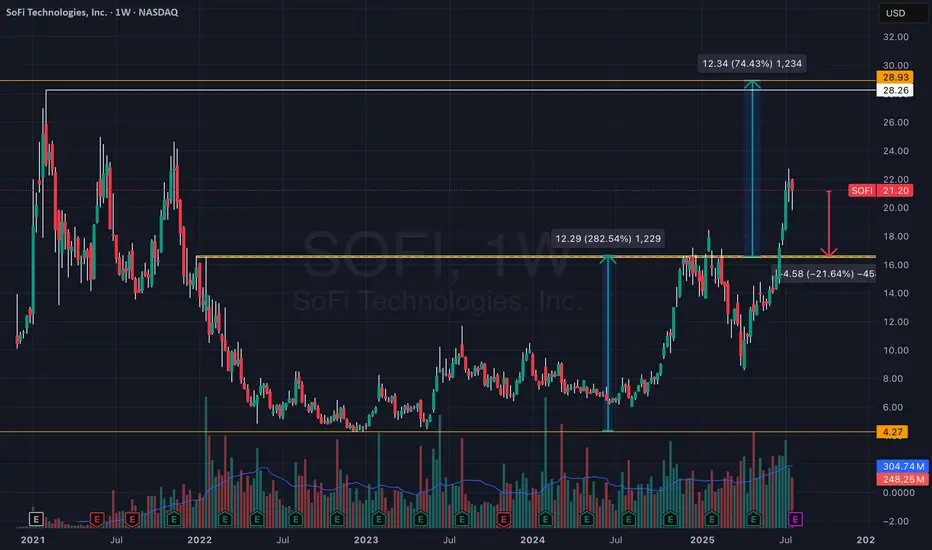
Weekly chart. As simple as it gets.
What I’m seeing: a breakout from a classic cup-and-handle formation, with the breakout point around $16.5.
This setup carries potential for a move toward all-time highs near $28.
— Important note:
A pullback to the $16.5 zone would still not break the breakout structure — in fact, this would be a textbook retest of the breakout level.
Yes, there’s still room for a ~20% downside from current levels, but this would still be within the structure of a larger bullish move toward ATH.
No doubt in my mind — if we revisit $16.5, I’ll be loading up on SOFI like crazy.
Disclaimer
The information and publications are not meant to be, and do not constitute, financial, investment, trading, or other types of advice or recommendations supplied or endorsed by TradingView. Read more in the Terms of Use.
Disclaimer
The information and publications are not meant to be, and do not constitute, financial, investment, trading, or other types of advice or recommendations supplied or endorsed by TradingView. Read more in the Terms of Use.