SOFI has seen impressive upward momentum recently, breaking out of a downtrend and consolidating near key resistance. This trading plan outlines critical levels, price action insights, and actionable setups for both scalping and swing trades as SOFI navigates this crucial zone.
Market Structure & Price Action:
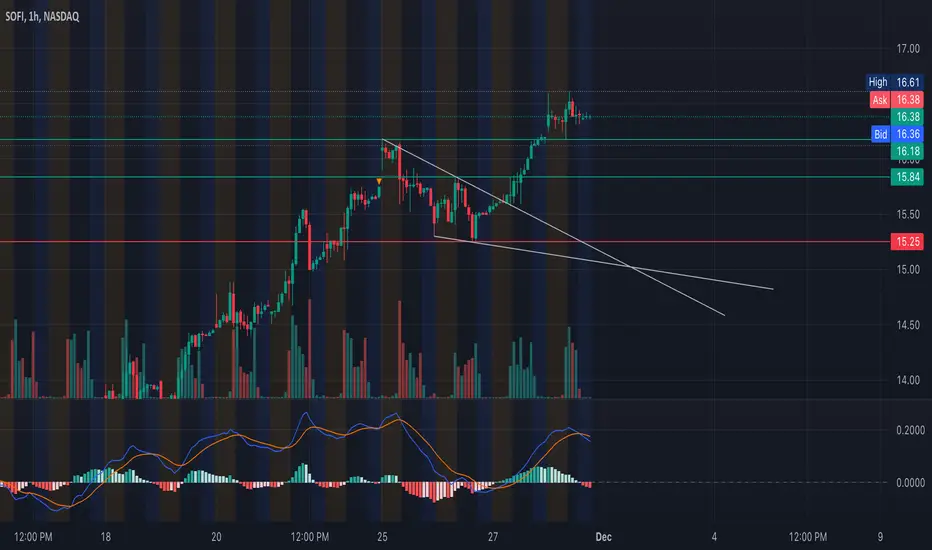
* Recent Trend: SOFI has broken above its previous resistance of $16 and is consolidating near $16.38.
* Liquidity Zones:
* Buyers established strong support around $15.25–$15.50, forming a key demand zone.
* Sellers remain active near $16.50–$16.61, creating overhead resistance.
* Volume Profile: Strong bullish volume accompanied the breakout, but the recent consolidation shows volume tapering off slightly, indicating indecision.
Key Levels:
1. Resistance Zones:
* $16.50–$16.61: Immediate resistance zone where sellers have shown strength.
* $17: Key psychological level and a potential breakout target.
2. Support Zones:
* $16.10–$16.20: Short-term support within the consolidation range.
* $15.25–$15.50: Strong demand zone and previous breakout level.
Indicators:
* MACD (1-hour): The bullish crossover remains intact, but the histogram shows slowing momentum, indicating consolidation or a potential pullback.
* Volume: Declining volume during consolidation suggests a possible breakout if volume returns on a strong move.
Trade Ideas:
1. Scalping Setup:
* Entry (Long): Above $16.50 with confirmation (bullish candles and increasing volume).
* Target: $16.75–$17.
* Stop-Loss: Below $16.30.
* Short Setup: If price fails to hold $16.20, consider shorting with a target of $15.50 and a stop above $16.40.
2. Swing Trading Setup:
* Bullish Case:
* Entry: On a breakout above $16.61.
* Target 1: $17.
* Target 2: $18.
* Stop-Loss: Below $16.30.
* Bearish Case:
* Entry: Short below $15.25.
* Target 1: $14.75.
* Target 2: $14.
* Stop-Loss: Above $15.50.
Thoughts & Outlook: SOFI’s recent breakout above $16 signals bullish strength, but the stock is approaching significant resistance near $16.61. A breakout could propel the stock toward $17 and higher, while failure to hold current levels may lead to a retest of support around $15.50. Traders should focus on clear setups and volume confirmation before entering trades.
Disclaimer: This analysis is for educational purposes only and does not constitute financial advice. Please conduct your own research and trade responsibly. Trading involves risk.
Market Structure & Price Action:
* Recent Trend: SOFI has broken above its previous resistance of $16 and is consolidating near $16.38.
* Liquidity Zones:
* Buyers established strong support around $15.25–$15.50, forming a key demand zone.
* Sellers remain active near $16.50–$16.61, creating overhead resistance.
* Volume Profile: Strong bullish volume accompanied the breakout, but the recent consolidation shows volume tapering off slightly, indicating indecision.
Key Levels:
1. Resistance Zones:
* $16.50–$16.61: Immediate resistance zone where sellers have shown strength.
* $17: Key psychological level and a potential breakout target.
2. Support Zones:
* $16.10–$16.20: Short-term support within the consolidation range.
* $15.25–$15.50: Strong demand zone and previous breakout level.
Indicators:
* MACD (1-hour): The bullish crossover remains intact, but the histogram shows slowing momentum, indicating consolidation or a potential pullback.
* Volume: Declining volume during consolidation suggests a possible breakout if volume returns on a strong move.
Trade Ideas:
1. Scalping Setup:
* Entry (Long): Above $16.50 with confirmation (bullish candles and increasing volume).
* Target: $16.75–$17.
* Stop-Loss: Below $16.30.
* Short Setup: If price fails to hold $16.20, consider shorting with a target of $15.50 and a stop above $16.40.
2. Swing Trading Setup:
* Bullish Case:
* Entry: On a breakout above $16.61.
* Target 1: $17.
* Target 2: $18.
* Stop-Loss: Below $16.30.
* Bearish Case:
* Entry: Short below $15.25.
* Target 1: $14.75.
* Target 2: $14.
* Stop-Loss: Above $15.50.
Thoughts & Outlook: SOFI’s recent breakout above $16 signals bullish strength, but the stock is approaching significant resistance near $16.61. A breakout could propel the stock toward $17 and higher, while failure to hold current levels may lead to a retest of support around $15.50. Traders should focus on clear setups and volume confirmation before entering trades.
Disclaimer: This analysis is for educational purposes only and does not constitute financial advice. Please conduct your own research and trade responsibly. Trading involves risk.
Disclaimer
The information and publications are not meant to be, and do not constitute, financial, investment, trading, or other types of advice or recommendations supplied or endorsed by TradingView. Read more in the Terms of Use.
Disclaimer
The information and publications are not meant to be, and do not constitute, financial, investment, trading, or other types of advice or recommendations supplied or endorsed by TradingView. Read more in the Terms of Use.