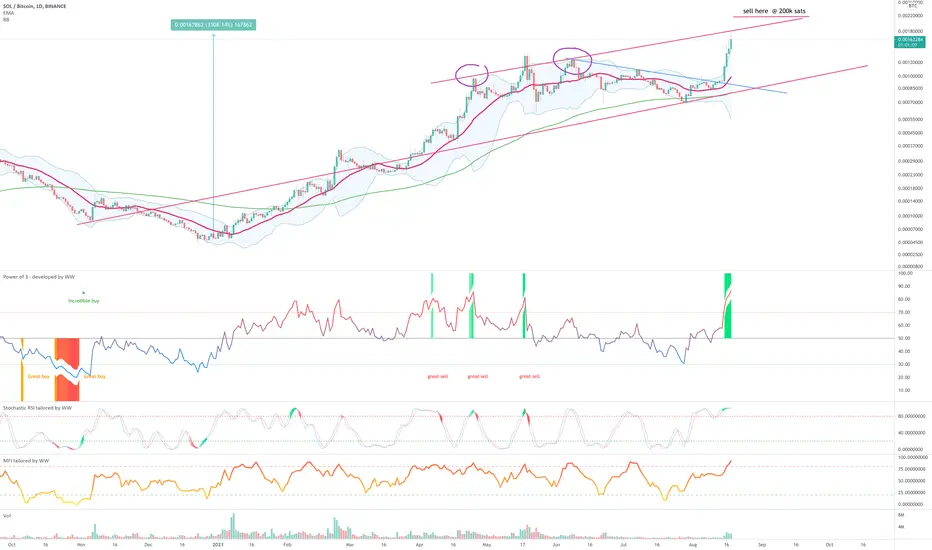
On the above 1-day chart price action has increased 3300% against Bitcoin. Fantastic. A number of reasons now exist to turn bearish. They include:
1) The overbought indicator (green column). No sell signal yet, but it is in the post. Look left.
2) Price action has been trending in the upward channel since the beginning of the year. Price action is currently testing the upper side of the channel. The last 3 occasions it was rejected. Look left.
3) The Bollinger band price action is way outside the upper half of the band. Remember 95% of all price action trades inside the band. Against Look left when this far outside.
4) On the weekly chart (below) 5 oscillators are showing ‘bearish divergence’ with price action as price action tests the upper Chanel - perhaps this time is different?!
Sell from 200k sats if you can get it.
Fully expecting price action to break the upper channel, which will ultimately result in a fake out.
Good luck!
WW
Weekly chart:
Trade active
The 'great sell' alert signal appeared today. However I still expect a spike to 200k sats. Heck of a risk though.Trade active
At 200k sats as expected. A sell at those levels is fantastic. A sell from anything up to 250k is amazing.Note
A lot of PM's telling me this short trade is toast. Emotion folks, it is a money killer. Pay no attention. The current price action is exactly where it is expected.On the daily chart below I've circled in purple one of the overlays used by the 'great sale' indicator. It is not a moving average! Look left. In terms of probability it is very clear what is about to happen.
Remember 95% of folks will be buyers right now when they see prices rallying. You want to be the 5%.
Good luck!
WW
Trade active
3-day chart below showing price action well outside the Bollinger Band (circled in purple). Look left, it is no mystery what will happen next.95% of all price action trades inside the band.
Note
Could go all the way to 400 sats, but observe the risk. Price action is rallying within a bearish rising wedge pattern. The apex is around 400 sats / $170Note
Calling the top is so difficult, which is reason enough not to try.On the daily the reversal is very clear on the daily with a 'gravestone DOJI' printed a few days ago + confirmation.
Trade active
Look for support around 25k sats as previous (purple circles) on the 2-day chart below. If confirmed expect a rally to 50k sats. If failed, the party is over.Note
Not yet confirmed but you should be aware of the head and shoulders forming on the 12-hour, 13k sats if confirmed.Note
Be careful if you're still long here.. a important resistance / support trend with considerable confluence is now being tested. Don't guess, wait for confirmation!Note
A 2nd "great sell" signal appears on the 4-day chart below. On this scale those signals are significant. The channel price action now finds itself in is a no mans land. Wait for confirmation as written on chart.Note
On market structure. It must hold this level to prevent a collapse.Trade active
A death cross has confirmed on the weekly chart. Do not expect great things from SOL in the up and coming bull run.BTC
bc1q2eckdzh0q8vsd7swcc8et6ze7s99khhxyl7zwy
Weblink: patreon.com/withoutworries
Allow 3-6 months on ideas. Not investment advice. DYOR
bc1q2eckdzh0q8vsd7swcc8et6ze7s99khhxyl7zwy
Weblink: patreon.com/withoutworries
Allow 3-6 months on ideas. Not investment advice. DYOR
Disclaimer
The information and publications are not meant to be, and do not constitute, financial, investment, trading, or other types of advice or recommendations supplied or endorsed by TradingView. Read more in the Terms of Use.
BTC
bc1q2eckdzh0q8vsd7swcc8et6ze7s99khhxyl7zwy
Weblink: patreon.com/withoutworries
Allow 3-6 months on ideas. Not investment advice. DYOR
bc1q2eckdzh0q8vsd7swcc8et6ze7s99khhxyl7zwy
Weblink: patreon.com/withoutworries
Allow 3-6 months on ideas. Not investment advice. DYOR
Disclaimer
The information and publications are not meant to be, and do not constitute, financial, investment, trading, or other types of advice or recommendations supplied or endorsed by TradingView. Read more in the Terms of Use.