SOL/USD Technical Analysis – 4H Chart 📊
Currently, SOL/USD is testing a strong support zone around $140, which has previously acted as a key level for price reactions. This area is crucial for determining the next move in the market.
🔹 Current Market Overview:
Support: $140
Resistance Levels: Next key resistance at $150-$155
RSI: Monitoring if it enters the oversold region (<30)
Moving Averages: Checking interaction with the 21/50 EMAs
🔥 Possible Scenarios:
1️⃣ If the $140 support holds 📈
A bullish reaction could push the price towards $150-$155.
Best entry if we see strong rejection and increasing volume.
2️⃣ If $140 support breaks 📉
The price might seek lower liquidity zones, potentially testing $135 or even $130.
In this case, waiting for a new confirmation would be safer.
🎯 Trading Strategy:
📍 Entry: If there is a strong rejection at $140 with rising buying volume.
📍 Stop Loss: Below $138 to minimize risk.
📍 Target: $150-$155 in the short term.
Monitoring volume and market strength is crucial to confirm the best entry. Interesting opportunity, but caution is needed in case of a support breakdown!
Trade active
Deep analysisSOL/USD Chart Analysis – 4H
Key Support and Resistance Levels
In the 4-hour chart of SOL/USD, we identify a strong support zone around $130–$131. This level was recently tested and held the price, marking an important bottom. If the $130.68 support (recent low) is lost, the next significant support area would be $120–$121, which historically represents a major monthly support level.
On the other hand, immediate resistance is around $145, a level where the price has struggled to advance in recent rallies. This $145–$147 zone has rejected multiple bullish attempts, preventing SOL from sustaining prices above it. If the market breaks firmly above $146, the next key resistance area is $154–$157 (previous highs/lows), as identified by analysts.
Beyond that, additional resistances emerge at $169 and higher levels, but in the short term, the focus remains on the $130–$145 range.
Chart Patterns and Volume
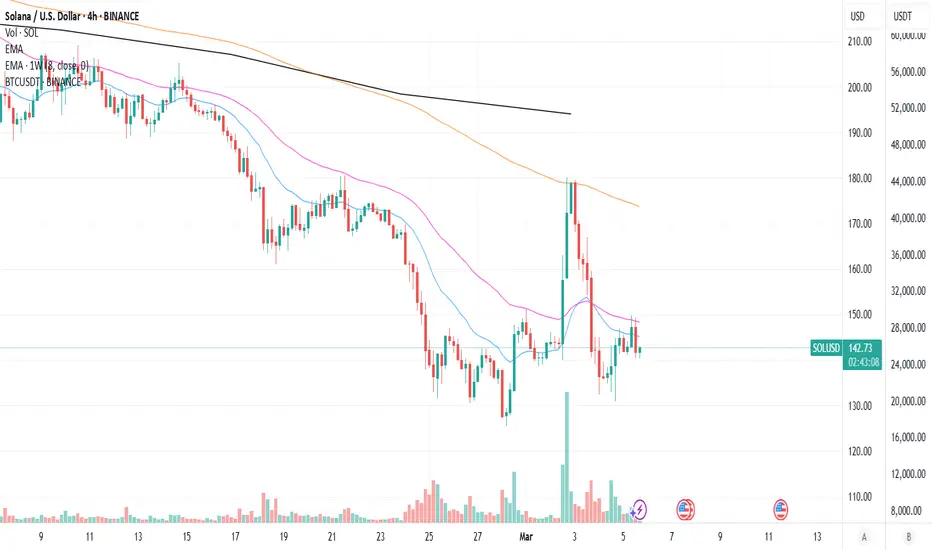
4H SOL/USDT Chart (TradingView)
The chart shows a descending channel (blue lines) with resistance around $145 (red zone) and support near ~$130 (green zone). Volume indicators and oscillators (MACD/RSI) highlight overbought and oversold conditions, as well as moving average crossovers (golden cross/death cross) throughout price movements.
The dominant pattern recently has been a descending channel or short-term downtrend. Lower highs and lower lows indicate that SOL attempted some rebounds but failed to break the descending trendline marked by these lower peaks.
For instance, even after a strong upward move (from ~$130 support to around $147), the price fell back into the bearish trend. This behavior suggests the presence of active sellers near resistance.
Additionally, we can interpret the formation of a possible descending triangle, where horizontal support around ~$130 and lower highs reinforce a bearish bias unless a breakout occurs to the upside.
Regarding volume, there was a significant increase during the recent declines and recoveries.
During the last major bearish leg, SOL’s daily volume hit $10 billion, indicating strong selling pressure, possibly from whales (large market participants) liquidating positions.
However, in the last few hours/days, volume has increased during upward moves, suggesting that buyers are stepping in at lower prices—demand is starting to recover after the liquidation phase.
In summary, high volume has accompanied sharp price moves (12% drop followed by an 8% recovery), showing that significant interest exists around these price levels, whether defending support or selling at resistance.
Moving Averages (EMA 21, EMA 50, EMA 200) and Overall Trend
The medium-term trend for SOL/USD remains bearish.
The asset has undergone a sharp correction (~26% drop over the past month), which is reflected in the moving averages.
On the 4H chart, the price is still below the EMA 200—a clear bearish sign, as this average represents the long-term trend in intraday charts.
Short-term moving averages, such as EMA 21 and EMA 50, are also pointing downward and positioned below the EMA 200, confirming a bearish setup.
Key MA Crossovers:
Recently, in higher timeframes, the 30-day moving average crossed below the 200-day moving average in late February (a death cross), reinforcing the loss of bullish momentum.
A technical analysis study indicates that currently, around 93% of moving average signals are bearish for SOL.
In other words, almost all key MAs are acting as dynamic resistance levels, and only when the price surpasses them will we see a solid reversal.
With the recent bounce from ~$130 to ~$147, very short-term EMAs (like the 21-period in 4H) may be flattening or catching up with price. However, EMA 50 and especially EMA 200 in 4H are still above the current price, reflecting the downward trajectory of recent weeks.
A confirmed breakout above these MAs (e.g., consolidating above the 4H EMA 200) would indicate a structural shift from a bearish to a bullish trend.
BTC’s Influence and Market Sentiment
SOL’s price action has been highly correlated with the broader market sentiment, especially with Bitcoin.
In recent days, Solana dropped alongside the broader crypto market during periods of general pessimism.
Macro news and global events (such as trade war fears, exchange hacks, etc.) have affected Bitcoin, which in turn pressured altcoins like SOL.
For example:
A proposed strategic crypto reserve policy in the U.S. created volatility—BTC rallied and then pulled back, and SOL followed suit, dropping ~16% over a volatile weekend.
Currently, BTC remains in an uncertain/bearish short-term trend, which limits SOL’s upside potential.
If Bitcoin experiences another correction or loses key support levels, SOL will likely break below $130, targeting lower prices.
Conversely, if BTC recovers and risk appetite returns, this should help SOL break above its $145 barrier.
🔹 Bottom line: Tracking BTC’s behavior and overall market sentiment is crucial.
Bitcoin dominance and investor sentiment (fear or optimism) will have a major impact on SOL’s ability to reverse its current trend.
Possible Entry and Exit Points (Short-Term Trading)
Based on this technical analysis, we can outline short-term strategies considering key inflection points:
📌 📈 Long Entry (Buy Opportunity):
A conservative buy entry would be near the $130–$135 support zone, but only if there are bottoming signals (e.g., reversal candlestick patterns or RSI exiting oversold territory).
Buying near a strong support level can offer a good risk-reward ratio, with a tight stop-loss just below $130 (as losing this level would invalidate the immediate bullish case).
Initial target: $145, where partial take profit or profit protection is recommended due to resistance.
If SOL shows strength and breaks $145 with volume, part of the position could be held for the next resistance at $154–$157.
📌 📉 Short Entry (Sell Opportunity):
Given the dominant bearish bias, shorting at resistances has been a successful strategy.
A potential short entry could be in the $142–$146 zone, IF price shows weakness near this resistance (e.g., fake breakouts or bearish RSI divergences).
Stop-loss: Just above $147, to protect against a legitimate breakout.
Initial target: A return to $130–$132 support, where most of the short position should be closed.
If $130 support breaks, the target could be extended to $121–$125, anticipating a stronger breakdown.
Summary:
For short-term trades, closely monitoring the $145 (resistance) and $130 (support) levels is crucial.
Trading in favor of the trend (which is still bearish) generally has a higher probability of success, so shorting resistance remains a logical approach as long as SOL stays below key MAs and resistances.
However, the strong support at $130 and a possible technical bounce offer a good buying opportunity, aiming for a rally toward resistance.
Disclaimer
The information and publications are not meant to be, and do not constitute, financial, investment, trading, or other types of advice or recommendations supplied or endorsed by TradingView. Read more in the Terms of Use.
Disclaimer
The information and publications are not meant to be, and do not constitute, financial, investment, trading, or other types of advice or recommendations supplied or endorsed by TradingView. Read more in the Terms of Use.