My base case is we still have not bottomed. However it's become slightly clearer that this consolidation with an upward bias must play out and it appears reconciliation may be higher.
Observing my chart above I've labeled all the prominent moves within this consolidation.
Lets break this down an stick strictly to facts:
1. The indecision of buyers and sellers in this area is best displayed in all the overlapping peaks (Orange Arrows) so this tells me we are in a countertrend consolidation. FACT
2. This OVERLAP is indicative of a wave 2,4 or a potential diagonal (LD or ED). FACT
3. Lastly, because of the first two facts, LABELING THIS AREA WILL REMAIN DIFFICULT BUT NOT IMPOSSIBLE. This area (on a micro level) remains an area that appears neither BULLISH or Immediately BEARISH. FACT
To get further clues within an area such as we are in we have to look to the technicals to guide us.
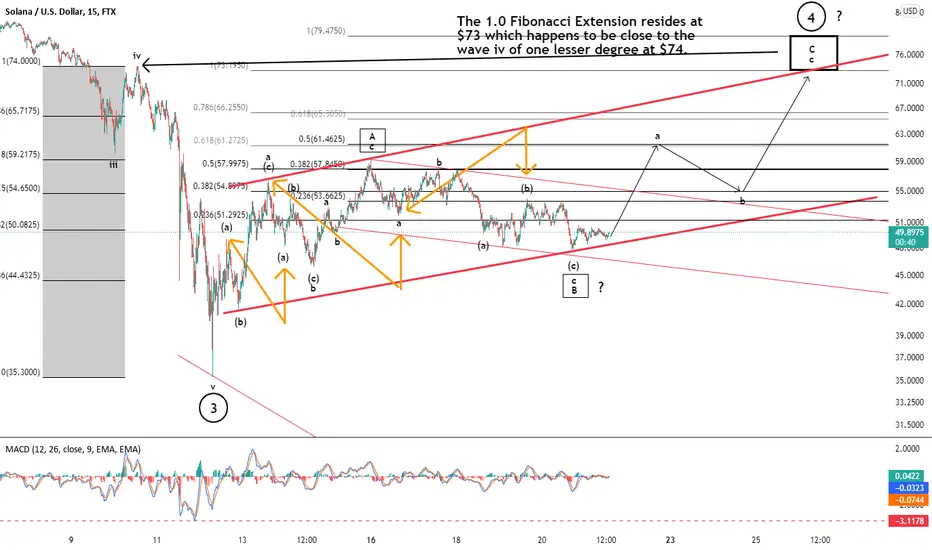
Based on the above 3 facts I have set out to label what this whole consolidation may mean. Our (SQUARE BOX A wave) which topped May 15th came right into the .618 Fib retracement. This would have been a very normal place to top and begin a decent in a wave 5 that would complete this whole sell off. However since then we have declined in an overlapping fashion. This wave 5 down should be an impulsive 5 wave structure. Post May 15th, the decline is anything but impulsive. Therefore I have no choice but to adopt the perspective that this wave 4 consolidation is NOT over and will ultimately reconcile higher. If that is the case we have to look for reasonable areas within the rules of EWP that this higher reconciliation could conclude. Our micro wave "iv" of "v" of the larger wave 3 topped at $74.
SO $74 IS A REASONABLE AREA TO CONCLUDE
$74 represents the wave 4 top of one lesser degree. Perfectly reasonable to conclude there.
$79.4750 IS ANOTHER AREA TO CONCLUDE
Using our Fib Extension Tool the 1.0 extension of Square Box "A" and what appears to be the bottom of a Square Box "B" is $79.4750. So although higher than the wave 4 of one lesser degree is it perfectly reasonable within a measured move to conclude there.
$73.195 IS THE ANOTHER AREA TO CONCLUDE
Using our Fib Extension Tool the 1.0 extension of minor wave "a" and the bottom of a minor wave "b" is $73.195.
I tend to keep my analysis as simple as I can until there is no simple explanation. So I'm counting this consolidation as a standard ABC into the $73.195 to $79.475 for final resolution of wave 4. This could change if price over the weekend dips below the Minor "b" wave bottom on May 14th of $46. Then we would have no choice but to recalculate ONCE AGAIN. However to keep it simple, as long as we remain above $46 price should conclude in the range of $73-$79.
Lastly, please beware of articles that say Solana has bottomed, or this consolidation appears to be a complex WXY, Yada, Yada Yada. I will repeat what I've written about many times previous. In a wave 4 of any significance most times, even the most experienced EWP practitioners, cannot label the pattern until it completes or is near completion. This fact speaks less to EWP being an accurate forecasting tool and MORE TO THE OPAQUE NATURE OF COUNTERTREND BEHAVIOUR.
Best to all,
Chris
Observing my chart above I've labeled all the prominent moves within this consolidation.
Lets break this down an stick strictly to facts:
1. The indecision of buyers and sellers in this area is best displayed in all the overlapping peaks (Orange Arrows) so this tells me we are in a countertrend consolidation. FACT
2. This OVERLAP is indicative of a wave 2,4 or a potential diagonal (LD or ED). FACT
3. Lastly, because of the first two facts, LABELING THIS AREA WILL REMAIN DIFFICULT BUT NOT IMPOSSIBLE. This area (on a micro level) remains an area that appears neither BULLISH or Immediately BEARISH. FACT
To get further clues within an area such as we are in we have to look to the technicals to guide us.
Based on the above 3 facts I have set out to label what this whole consolidation may mean. Our (SQUARE BOX A wave) which topped May 15th came right into the .618 Fib retracement. This would have been a very normal place to top and begin a decent in a wave 5 that would complete this whole sell off. However since then we have declined in an overlapping fashion. This wave 5 down should be an impulsive 5 wave structure. Post May 15th, the decline is anything but impulsive. Therefore I have no choice but to adopt the perspective that this wave 4 consolidation is NOT over and will ultimately reconcile higher. If that is the case we have to look for reasonable areas within the rules of EWP that this higher reconciliation could conclude. Our micro wave "iv" of "v" of the larger wave 3 topped at $74.
SO $74 IS A REASONABLE AREA TO CONCLUDE
$74 represents the wave 4 top of one lesser degree. Perfectly reasonable to conclude there.
$79.4750 IS ANOTHER AREA TO CONCLUDE
Using our Fib Extension Tool the 1.0 extension of Square Box "A" and what appears to be the bottom of a Square Box "B" is $79.4750. So although higher than the wave 4 of one lesser degree is it perfectly reasonable within a measured move to conclude there.
$73.195 IS THE ANOTHER AREA TO CONCLUDE
Using our Fib Extension Tool the 1.0 extension of minor wave "a" and the bottom of a minor wave "b" is $73.195.
I tend to keep my analysis as simple as I can until there is no simple explanation. So I'm counting this consolidation as a standard ABC into the $73.195 to $79.475 for final resolution of wave 4. This could change if price over the weekend dips below the Minor "b" wave bottom on May 14th of $46. Then we would have no choice but to recalculate ONCE AGAIN. However to keep it simple, as long as we remain above $46 price should conclude in the range of $73-$79.
Lastly, please beware of articles that say Solana has bottomed, or this consolidation appears to be a complex WXY, Yada, Yada Yada. I will repeat what I've written about many times previous. In a wave 4 of any significance most times, even the most experienced EWP practitioners, cannot label the pattern until it completes or is near completion. This fact speaks less to EWP being an accurate forecasting tool and MORE TO THE OPAQUE NATURE OF COUNTERTREND BEHAVIOUR.
Best to all,
Chris
Disclaimer
The information and publications are not meant to be, and do not constitute, financial, investment, trading, or other types of advice or recommendations supplied or endorsed by TradingView. Read more in the Terms of Use.
Disclaimer
The information and publications are not meant to be, and do not constitute, financial, investment, trading, or other types of advice or recommendations supplied or endorsed by TradingView. Read more in the Terms of Use.