Trading Journal Entry: SOL/USDT SHORT
Date of Entry: July 8, 2025
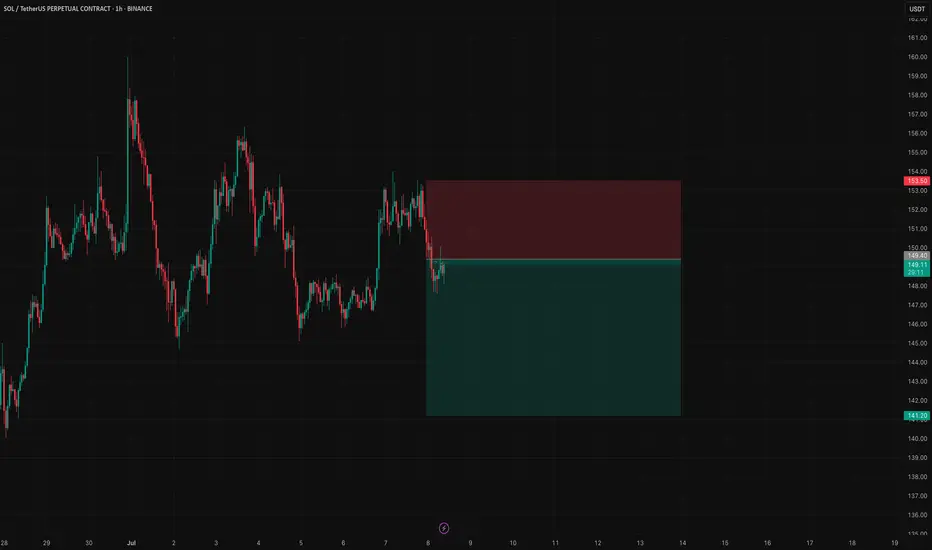
Asset: SOL/USDT Perpetual Futures
Position: SHORT
Entry Price: $149.40
Stop Loss: $153.50
Take Profit: $141.20
Risk/Reward Ratio: 2.00:1
Setup Grade: A+
1. Core Thesis
The trade is a high-confluence short position designed to capitalize on a probable breakdown of a key support level, driven by overwhelming bearish sentiment and a clear liquidity-based objective. The core thesis is that the market, having failed to show strength at a critical resistance point within a larger downtrend, is incentivized to purge the liquidity resting at the bottom of the local range.
2. High-Timeframe Context (The Strategic Landscape)
My analysis began with a top-down approach to understand the broader market environment.
Weekly Context: The market is in a multi-month corrective phase after a significant long-term uptrend. This indicates that the primary bullish momentum has stalled, making the market susceptible to deeper corrections and range-bound activity. Trading between major HTF zones is the governing dynamic.
Daily Context: The immediate trend on the daily chart is clearly bearish, defined by a series of lower highs and lower lows. This downtrend brought the price to a pivotal support zone identified by the Volume Profile Point of Control (POC) around $140-$145. This created the central conflict: a dominant bearish trend meeting a significant historical support level.
3. Order Flow & Sentiment Analysis (The Deciding Factor)
This layer of analysis was the key to resolving the trend vs. support conflict and solidified the bearish bias.
Liquidation Analysis: The liquidation maps revealed a very large and proximate pool of long liquidations concentrated around $145. This liquidity cluster acts as a powerful magnet for price, providing a clear, logical target for a downside move.
Funding Rate Analysis: Funding rates across the majority of major exchanges were negative. This provided clear evidence that derivative traders were predominantly positioned short and were willing to pay a premium to maintain those positions. In this context of price failing at resistance, it signaled strong bearish conviction and a market leaning heavily in one direction.
Synthesis: The presence of a large downside liquidity target (the "magnet") combined with dominant bearish sentiment (the "conviction") created a high-probability scenario for a breakdown. The path of least resistance was for the market to resolve the consolidation by pushing down to trigger the liquidity pool below.
4. Tactical Execution (The Entry Trigger)
With a firm directional bias, the final step was to find a low-risk entry.
4-Hour Structure: The price action leading into the entry was weak. The 4H chart showed a low-volume, corrective bounce that failed to decisively reclaim its Point of Control around $150. This lack of a strong rejection from the lows was a critical sign that buyers lacked control and that the support was fragile.
1-Hour Entry Pattern: I identified the perfect entry trigger on the 1H chart.
Price formed a tight consolidation pattern, building a clear support base around the $149.50 - $150.00 level.
The volume throughout this consolidation was visibly declining, indicating a coiling of energy before a volatile move.
My entry at $149.40 was a stop-limit order placed to trigger on a confirmed breakdown of this immediate support, allowing us to join the move with momentum.
5. Risk Management (The Trade's Foundation)
Stop Loss ($153.50): The SL was not an arbitrary price but a logical invalidation point. It was placed just above the structural high of the 1-hour consolidation range. A move to this level would have proven the breakdown thesis incorrect and signaled that buyers had absorbed the selling pressure.
Take Profit ($141.20): The TP was chosen for two reasons:
Rule Compliance: It mathematically secured my required 2:1 risk/reward ratio.
Strategic Placement: It sits just above the major daily support zone and the daily POC, increasing the probability of a fill before a significant HTF reaction and potential bounce.
This trade represents a textbook example of our strategy: using high-timeframe analysis to build a directional bias, confirming it with order flow and liquidity data, and executing with precision on a low-timeframe pattern, all while adhering to strict, non-negotiable risk management rules.
Date of Entry: July 8, 2025
Asset: SOL/USDT Perpetual Futures
Position: SHORT
Entry Price: $149.40
Stop Loss: $153.50
Take Profit: $141.20
Risk/Reward Ratio: 2.00:1
Setup Grade: A+
1. Core Thesis
The trade is a high-confluence short position designed to capitalize on a probable breakdown of a key support level, driven by overwhelming bearish sentiment and a clear liquidity-based objective. The core thesis is that the market, having failed to show strength at a critical resistance point within a larger downtrend, is incentivized to purge the liquidity resting at the bottom of the local range.
2. High-Timeframe Context (The Strategic Landscape)
My analysis began with a top-down approach to understand the broader market environment.
Weekly Context: The market is in a multi-month corrective phase after a significant long-term uptrend. This indicates that the primary bullish momentum has stalled, making the market susceptible to deeper corrections and range-bound activity. Trading between major HTF zones is the governing dynamic.
Daily Context: The immediate trend on the daily chart is clearly bearish, defined by a series of lower highs and lower lows. This downtrend brought the price to a pivotal support zone identified by the Volume Profile Point of Control (POC) around $140-$145. This created the central conflict: a dominant bearish trend meeting a significant historical support level.
3. Order Flow & Sentiment Analysis (The Deciding Factor)
This layer of analysis was the key to resolving the trend vs. support conflict and solidified the bearish bias.
Liquidation Analysis: The liquidation maps revealed a very large and proximate pool of long liquidations concentrated around $145. This liquidity cluster acts as a powerful magnet for price, providing a clear, logical target for a downside move.
Funding Rate Analysis: Funding rates across the majority of major exchanges were negative. This provided clear evidence that derivative traders were predominantly positioned short and were willing to pay a premium to maintain those positions. In this context of price failing at resistance, it signaled strong bearish conviction and a market leaning heavily in one direction.
Synthesis: The presence of a large downside liquidity target (the "magnet") combined with dominant bearish sentiment (the "conviction") created a high-probability scenario for a breakdown. The path of least resistance was for the market to resolve the consolidation by pushing down to trigger the liquidity pool below.
4. Tactical Execution (The Entry Trigger)
With a firm directional bias, the final step was to find a low-risk entry.
4-Hour Structure: The price action leading into the entry was weak. The 4H chart showed a low-volume, corrective bounce that failed to decisively reclaim its Point of Control around $150. This lack of a strong rejection from the lows was a critical sign that buyers lacked control and that the support was fragile.
1-Hour Entry Pattern: I identified the perfect entry trigger on the 1H chart.
Price formed a tight consolidation pattern, building a clear support base around the $149.50 - $150.00 level.
The volume throughout this consolidation was visibly declining, indicating a coiling of energy before a volatile move.
My entry at $149.40 was a stop-limit order placed to trigger on a confirmed breakdown of this immediate support, allowing us to join the move with momentum.
5. Risk Management (The Trade's Foundation)
Stop Loss ($153.50): The SL was not an arbitrary price but a logical invalidation point. It was placed just above the structural high of the 1-hour consolidation range. A move to this level would have proven the breakdown thesis incorrect and signaled that buyers had absorbed the selling pressure.
Take Profit ($141.20): The TP was chosen for two reasons:
Rule Compliance: It mathematically secured my required 2:1 risk/reward ratio.
Strategic Placement: It sits just above the major daily support zone and the daily POC, increasing the probability of a fill before a significant HTF reaction and potential bounce.
This trade represents a textbook example of our strategy: using high-timeframe analysis to build a directional bias, confirming it with order flow and liquidity data, and executing with precision on a low-timeframe pattern, all while adhering to strict, non-negotiable risk management rules.
Disclaimer
The information and publications are not meant to be, and do not constitute, financial, investment, trading, or other types of advice or recommendations supplied or endorsed by TradingView. Read more in the Terms of Use.
Disclaimer
The information and publications are not meant to be, and do not constitute, financial, investment, trading, or other types of advice or recommendations supplied or endorsed by TradingView. Read more in the Terms of Use.