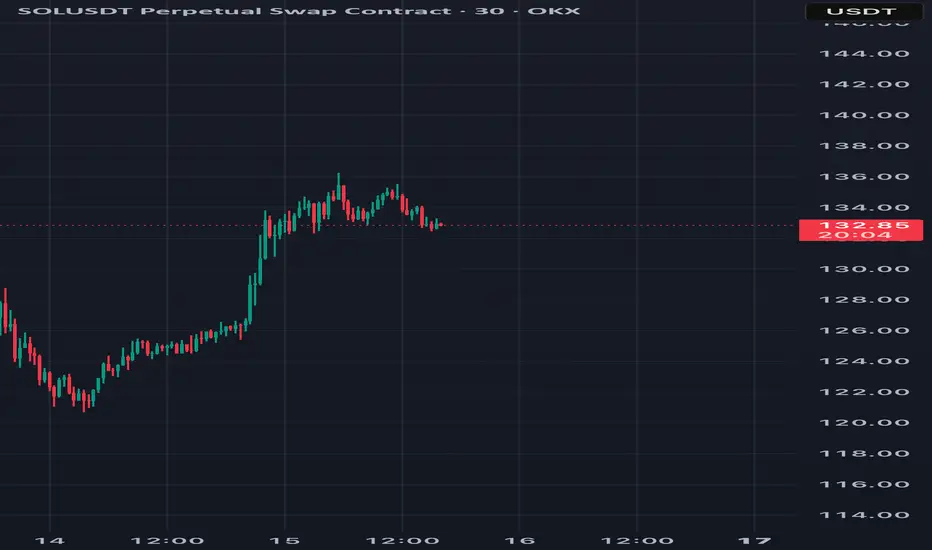
📉 SOLUSDT (30M) Analysis - Should You Short?
Based on the 30-minute timeframe, SOL is currently trading at 132.85 USDT (-0.52%). Here’s an analysis to help you decide whether to open a short position.
⸻
🔎 Factors Supporting a Short Position
✅ Bearish Signal (50% Down)
• Increased selling pressure with indicators signaling a potential downtrend.
✅ Fibonacci Retracement Suggesting Downside Targets
• TP1: 130.31 USDT (-4.5%)
• TP2: 128.48 USDT (-6%)
• TP3: 126.64 USDT (-7.6%)
• TP4: 124.02 USDT (-9.8%)
• TP5: 122.46 USDT (-11%)
• TP6: 120.69 USDT (-12.9%)
✅ EMA 20 Acting as Resistance
• If the price stays below the EMA 20, it could confirm a continued downtrend.
✅ Key Support Level at 130.11 USDT
• If SOL breaks below this level, the price may drop further toward 128 - 126 USDT.
⸻
🚨 Risk Factors to Consider Before Shorting
❌ Support at 130.11 USDT May Cause a Bounce
• Monitor whether SOL holds above this level before entering a short position.
❌ Stop Loss at 139.93 USDT (If the Price Reverses Upward)
• If SOL breaks above the 136 - 139 USDT resistance zone, it could flip bullish instead.
⸻
📊 Recommended Trading Strategy
📌 Short Entry Conditions:
• If SOL closes below 130.11 USDT, a short position targeting 128 - 126 USDT could be considered.
• If SOL retests the 136 - 139 USDT resistance and gets rejected, a short entry may be valid.
📌 Long Entry Conditions (If Trend Reverses to Bullish):
• If SOL breaks above 139 USDT, wait for confirmation before considering a long position.
⸻
✅ Final Recommendation
• Wait for a break below 130.11 USDT before shorting for better confirmation.
• Set a stop loss at 139.93 USDT to manage risk.
• Use volume and RSI indicators for further validation.
📉 Overall: Shorting is viable if SOL breaks below 130.11 USDT, but monitor support levels closely! 🚨
Disclaimer
The information and publications are not meant to be, and do not constitute, financial, investment, trading, or other types of advice or recommendations supplied or endorsed by TradingView. Read more in the Terms of Use.
Disclaimer
The information and publications are not meant to be, and do not constitute, financial, investment, trading, or other types of advice or recommendations supplied or endorsed by TradingView. Read more in the Terms of Use.