SOLUSDT: The Bears' Defense Holds Firm at the Golden Ratio. What's Next?
The Solana market has undergone a significant correction from its all-time highs, and the recent price action suggests the downtrend may not be over. The current structure is defined by a clear rejection from a formidable resistance zone, signaling that sellers remain in control for now.
The Bearish Rejection & Crucial Resistance 🔴🚨
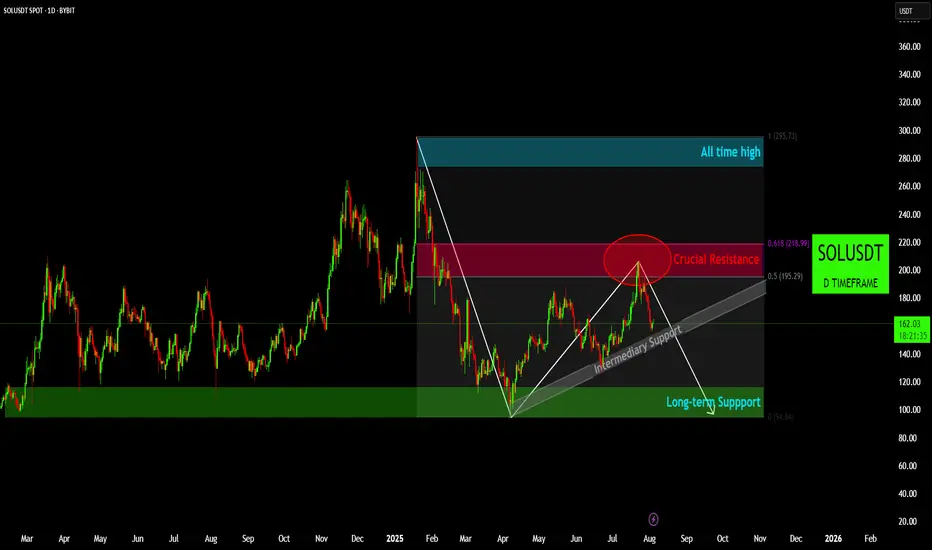
Following the initial sharp decline, price made a notable attempt at a recovery, forming a rising intermediary support trendline. However, this recovery rally was decisively halted at a critical level—a confluence of a Crucial Resistance Zone and the 0.5 to 0.618 Fibonacci retracement levels. This red zone, from approximately $195 to $218, has proven to be a major supply area. The recent price action saw a strong rejection from this region, with the price now breaking below its intermediary support trendline.
The Breakdown of Intermediary Support 📉
The rising white trendline, which had provided support for several months, has been broken. This breakdown is a significant bearish signal, indicating a loss of momentum and a potential shift in the short-term trend from bullish to bearish. This event increases the probability of a move toward lower support levels.
The Ultimate Line in the Sand: Long-term Support 💪🟢
Should the current bearish momentum continue, the next major demand zone is the Long-term Support area, a wide green band from approximately $100 to $120. This region has historically served as a strong base of support and represents the last major line of defense for the bulls. A test of this zone would be a significant event, and a break below it could lead to further extended declines.
What to Watch For: The Path to Bullish Confirmation 🚀
For the sentiment to turn definitively bullish, Solana needs to demonstrate a new wave of buying power that is strong enough to overcome the current overhead resistance. The market must see a sustained break and close above the Crucial Resistance Zone ($195-$218), specifically above the 0.618 Fibonacci level. A successful push above this formidable barrier, especially with strong volume, would invalidate the current bearish outlook and signal a potential move toward new highs. Until then, the path of least resistance remains to the downside.
Disclaimer:
The information provided in this chart is for educational and informational purposes only and should not be considered as investment advice. Trading and investing involve substantial risk and are not suitable for every investor. You should carefully consider your financial situation and consult with a financial advisor before making any investment decisions. The creator of this chart does not guarantee any specific outcome or profit and is not responsible for any losses incurred as a result of using this information. Past performance is not indicative of future results. Use this information at your own risk. This chart has been created for my own improvement in Trading and Investment Analysis. Please do your own analysis before any investments.
The Solana market has undergone a significant correction from its all-time highs, and the recent price action suggests the downtrend may not be over. The current structure is defined by a clear rejection from a formidable resistance zone, signaling that sellers remain in control for now.
The Bearish Rejection & Crucial Resistance 🔴🚨
Following the initial sharp decline, price made a notable attempt at a recovery, forming a rising intermediary support trendline. However, this recovery rally was decisively halted at a critical level—a confluence of a Crucial Resistance Zone and the 0.5 to 0.618 Fibonacci retracement levels. This red zone, from approximately $195 to $218, has proven to be a major supply area. The recent price action saw a strong rejection from this region, with the price now breaking below its intermediary support trendline.
The Breakdown of Intermediary Support 📉
The rising white trendline, which had provided support for several months, has been broken. This breakdown is a significant bearish signal, indicating a loss of momentum and a potential shift in the short-term trend from bullish to bearish. This event increases the probability of a move toward lower support levels.
The Ultimate Line in the Sand: Long-term Support 💪🟢
Should the current bearish momentum continue, the next major demand zone is the Long-term Support area, a wide green band from approximately $100 to $120. This region has historically served as a strong base of support and represents the last major line of defense for the bulls. A test of this zone would be a significant event, and a break below it could lead to further extended declines.
What to Watch For: The Path to Bullish Confirmation 🚀
For the sentiment to turn definitively bullish, Solana needs to demonstrate a new wave of buying power that is strong enough to overcome the current overhead resistance. The market must see a sustained break and close above the Crucial Resistance Zone ($195-$218), specifically above the 0.618 Fibonacci level. A successful push above this formidable barrier, especially with strong volume, would invalidate the current bearish outlook and signal a potential move toward new highs. Until then, the path of least resistance remains to the downside.
Disclaimer:
The information provided in this chart is for educational and informational purposes only and should not be considered as investment advice. Trading and investing involve substantial risk and are not suitable for every investor. You should carefully consider your financial situation and consult with a financial advisor before making any investment decisions. The creator of this chart does not guarantee any specific outcome or profit and is not responsible for any losses incurred as a result of using this information. Past performance is not indicative of future results. Use this information at your own risk. This chart has been created for my own improvement in Trading and Investment Analysis. Please do your own analysis before any investments.
Disclaimer
The information and publications are not meant to be, and do not constitute, financial, investment, trading, or other types of advice or recommendations supplied or endorsed by TradingView. Read more in the Terms of Use.
Disclaimer
The information and publications are not meant to be, and do not constitute, financial, investment, trading, or other types of advice or recommendations supplied or endorsed by TradingView. Read more in the Terms of Use.