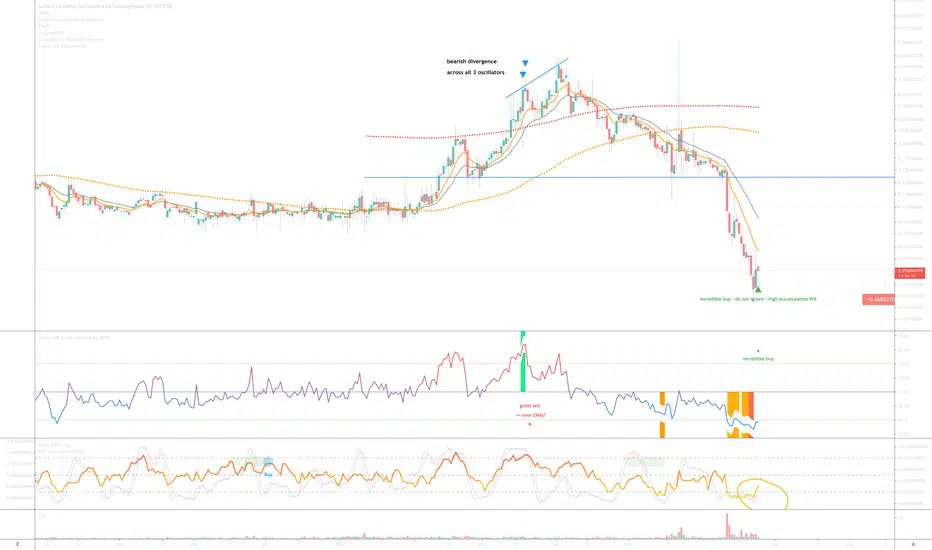
On the above 1-day chart a 90% correction follows the bearish divergence from early April. A ‘incredible buy’ opportunity now exists (orange column) with Stochastic RSI crossing up 20.
Price action is below every moving average going, considerably extended below the 10-day EMA, price action is basically at firesafe levels. If the Mayer multiple bands are switched on (below) you will see price action has fallen out of the bottom - these are opportunities you don’t see often.
Is it possible price action falls further? Absolutely.
Is it probable? Very unlikely.
1st target 15 cents / 165%
Good luck!
WW
Trade active
The mirror of the lower highs following the overbought signal, now we have higher lows across all oscillators following the oversold signal.Note
Also notice on the 3-day chart price action has return to previous support at the same time Stochastic RSI crossover has occurred (green shaded area).Trade active
UP 1100% since 'incredible buy' signalBTC
bc1q2eckdzh0q8vsd7swcc8et6ze7s99khhxyl7zwy
Weblink: patreon.com/withoutworries
Allow 3-6 months on ideas. Not investment advice. DYOR
bc1q2eckdzh0q8vsd7swcc8et6ze7s99khhxyl7zwy
Weblink: patreon.com/withoutworries
Allow 3-6 months on ideas. Not investment advice. DYOR
Disclaimer
The information and publications are not meant to be, and do not constitute, financial, investment, trading, or other types of advice or recommendations supplied or endorsed by TradingView. Read more in the Terms of Use.
BTC
bc1q2eckdzh0q8vsd7swcc8et6ze7s99khhxyl7zwy
Weblink: patreon.com/withoutworries
Allow 3-6 months on ideas. Not investment advice. DYOR
bc1q2eckdzh0q8vsd7swcc8et6ze7s99khhxyl7zwy
Weblink: patreon.com/withoutworries
Allow 3-6 months on ideas. Not investment advice. DYOR
Disclaimer
The information and publications are not meant to be, and do not constitute, financial, investment, trading, or other types of advice or recommendations supplied or endorsed by TradingView. Read more in the Terms of Use.