Thought I published this idea before yet cannot find it. On the above 1-day chart we have a bullish divergence between price action and the Money Flow index following an oversold condition (orange column). Additionally we have multiple bullish engulfing candles within the divergence - excellent.
On the 2-day chart below we can see price action is trading within a bullish falling wedge pattern. The resistance to the upside is limited before there is none - that makes upside potential very exciting.
Good luck.
2-day chart

On the 2-day chart below we can see price action is trading within a bullish falling wedge pattern. The resistance to the upside is limited before there is none - that makes upside potential very exciting.
Good luck.
2-day chart
Trade active
On the move at last.Trade active
Trade active
DOJI's everywhere! (sort of). This 4-day chart is also showing a clear hidden bullish divergence.Note
1-day chart looking very attractive as a 'great buy' opportunity signal is given.Target area highlighted in lime.
Trade active
Well done if you got in 4-5 days ago - always buy into fear.This sort of move is likely to be experienced by many alt coins, they are all ridiculously oversold at the moment.
Trade active
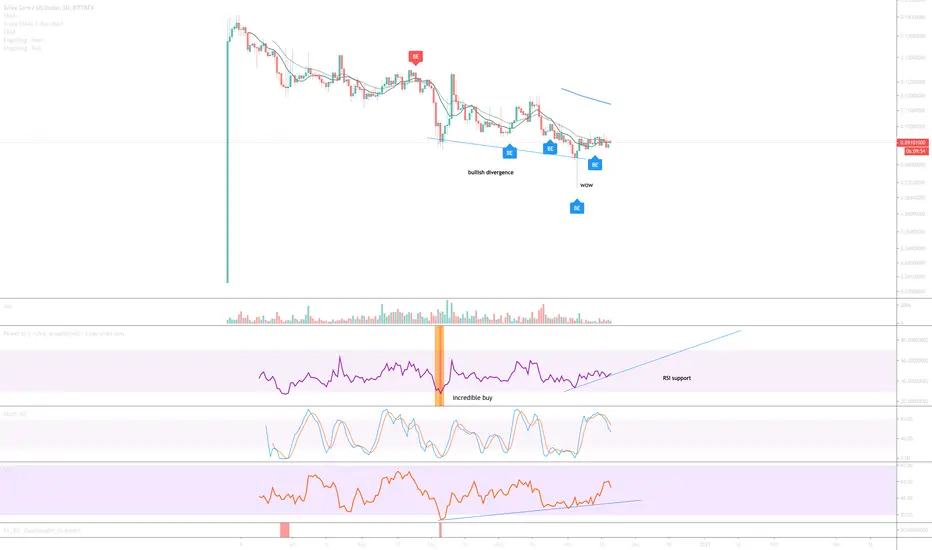
A 90% correction - brutal.For the brave among you a 'incredible buy' signal has illuminated.
Trade active
BTC
bc1q2eckdzh0q8vsd7swcc8et6ze7s99khhxyl7zwy
Weblink: patreon.com/withoutworries
Allow 3-6 months on ideas. Not investment advice. DYOR
bc1q2eckdzh0q8vsd7swcc8et6ze7s99khhxyl7zwy
Weblink: patreon.com/withoutworries
Allow 3-6 months on ideas. Not investment advice. DYOR
Disclaimer
The information and publications are not meant to be, and do not constitute, financial, investment, trading, or other types of advice or recommendations supplied or endorsed by TradingView. Read more in the Terms of Use.