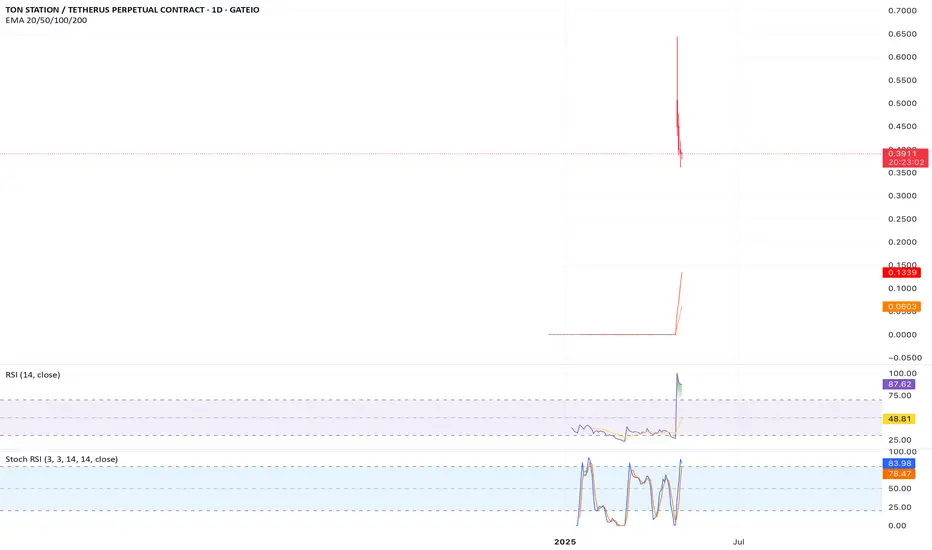
At $0.387,  SOON’s RSI sits near 25, indicating oversold conditions. Long-term charts show a historical support zone around $0.35–$0.40, suggesting a potential bounce if buying pressure returns. The 200-day moving average at ~$0.50 acts as resistance, but a breakout above could target $0.60 over 6–12 months. Volume trends are low, so watch for increased activity to confirm bullish momentum. #SOON #CryptoAnalysis
Disclaimer
The information and publications are not meant to be, and do not constitute, financial, investment, trading, or other types of advice or recommendations supplied or endorsed by TradingView. Read more in the Terms of Use.
Disclaimer
The information and publications are not meant to be, and do not constitute, financial, investment, trading, or other types of advice or recommendations supplied or endorsed by TradingView. Read more in the Terms of Use.