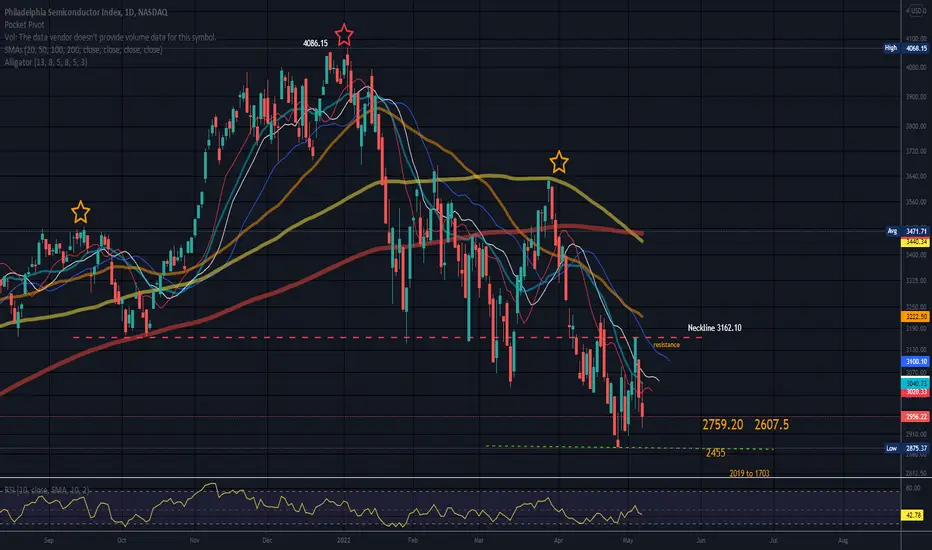
Price has broken the neckline and this level has been tested and passed the test as a level of resistance since the break to the downside. This tells me it may be a valid neckline as sometimes a neckline is hard to pinpoint.
Not a super clear downtrend, yet.
There are levels of support under price and I did not draw them all.
I also see a divergence, bearish, between price and RSI between the 1st shoulder and the head of this pattern.
Large orange type are possible targets 1. Targets 2 are smaller and are possible targets if targets 1 are passed.
No recommendation.
Any pattern, trendline, or any level of support/resistance can fail.
Note
Do not drown where this may go/be safe!Note
First 3 targets metDisclaimer
The information and publications are not meant to be, and do not constitute, financial, investment, trading, or other types of advice or recommendations supplied or endorsed by TradingView. Read more in the Terms of Use.
Disclaimer
The information and publications are not meant to be, and do not constitute, financial, investment, trading, or other types of advice or recommendations supplied or endorsed by TradingView. Read more in the Terms of Use.