SOXL Semiconductor 3 X Bull ETF Potential Move Up to 200
SOXL, Direction's Triple Bull Semiconductor ETF,
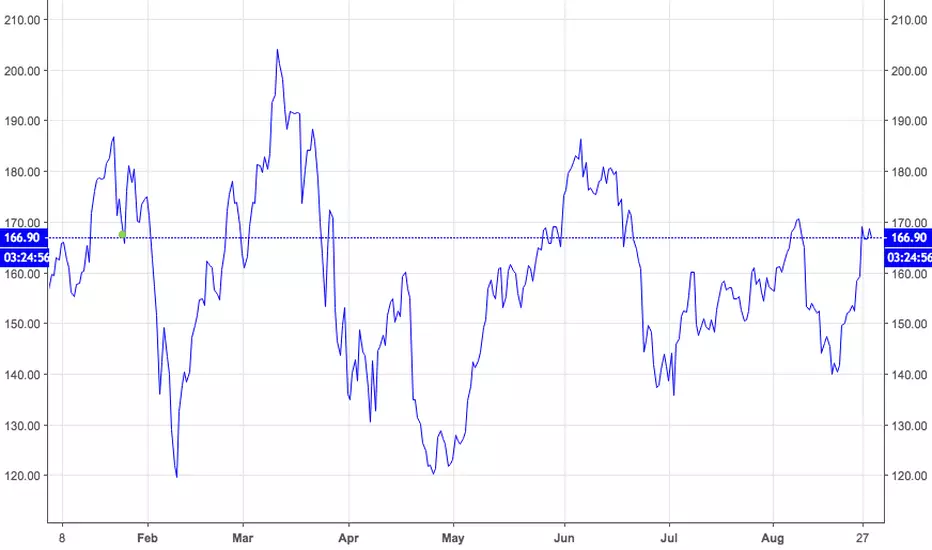
has formed what appears to be a powerful V bottom pattern formation
during the month of August with the chart pattern clearly showing
a bullish breakout above 170.50, from the recent low below 139,
would project the ETF back towards it's all time high at the 200 price area.
Semiconductor stocks are a market leading industry group have lead the recent sharp rally,
and a bullish breakout would certainly be a bullish continuation signal for the market.
I would use this ETF as a Bullish Hedge, against further advances in the market this fall.
STOP is at 138.00, 30 points away, so size position accordingly.
THE_UNWIND
Note
Bullish Hedge, as stated in my post. Please note.Hedged by short position on SOXS, 3 X Short Semiconductor ETF
I often hedge a long and short position in my trading account,
when I am not sure of the pending next major move in market direction.
I also do this also as to not be 100% exposed, long/or short side
if I am wrong in the market direction breakout.
THE_UNWIND
Note
Hedge Trade Cancelled.Sell SOXL 165.18 CL. 8/30/18
Buy SOXS 9.37 CL 8/30/18
Note
Update on Hedge :Closed Long Trade SOXL at 160
Added to Short SOXS Unhedged
Disclaimer
The information and publications are not meant to be, and do not constitute, financial, investment, trading, or other types of advice or recommendations supplied or endorsed by TradingView. Read more in the Terms of Use.
Disclaimer
The information and publications are not meant to be, and do not constitute, financial, investment, trading, or other types of advice or recommendations supplied or endorsed by TradingView. Read more in the Terms of Use.