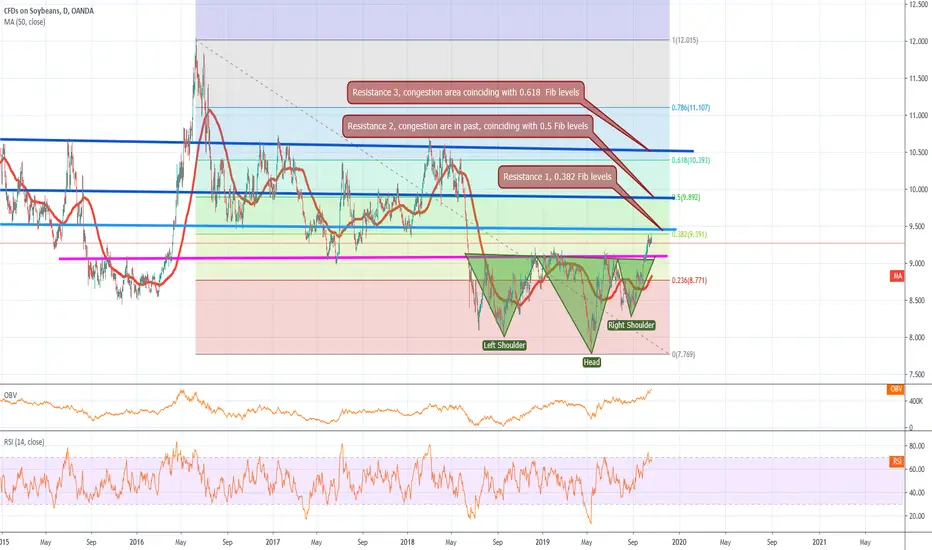
The story so far, we saw a dramatic and sharp fall in prices, then the price got into a rectangle like sideways formation where it tried to exit the channel and failed. This pattern being a bearish formation, was more like to exit downwards and so it did.
Post the downward break, it got into forming an inverse head and shoulder pattern, Please note that since this formation is made after a good fall in prices, there is a fair probability that the prices could have bottomed out
OBV and RSI also having an upwards slope.
Interesting to watch how price reacts from here.
Look out for LARGE CANDLES and VOLUME. These could be excellent times. If it doesn't breach current resistance (Blue zones) and drops to support levels (pink zone), wait for the bounce back of support to take long position with stop loss right below the peak of the right shoulder . Take profits initially as prescribed various higher Fib levels
If you like what you read, please share a thumbs up. Your comments will also be highly appreciated.
Cheers
If you love what you see, pls share a thumbs up and a comment in the section below
Disclaimer
The information and publications are not meant to be, and do not constitute, financial, investment, trading, or other types of advice or recommendations supplied or endorsed by TradingView. Read more in the Terms of Use.