Logarithm. Time frame 1 month (less is not necessary). The SP500 index primarily reflects the "health" of the American stock market and the economy as a whole. This is reflected in all markets by the domino effect.


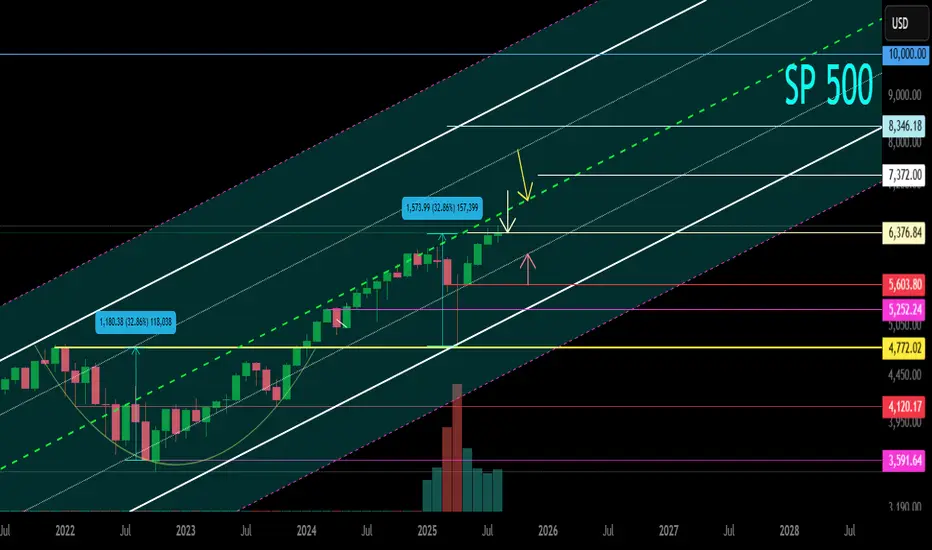
Now, after a huge takeout and recovery, the price is at the maximums of the local trend that has formed, and this is also the maximum of the index as a whole for its entire 100-year existence (before displaying on the chart).
🔄 Locally, the price has run into the resistance of the median of the ascending channel (green dotted line). Now the resistance level of this zone will be formed.
🟢 A breakout of this zone upwards - an exit above the median, promises strong growth and pumping of the stock market as a whole.
🔴 And the reverse process is not a breakthrough and not a consolidation above this zone - consolidation in the range under resistance and above the dynamic support of the internal channel. An extremely negative case is a decline in the lower zone of the channel.
🧠 The chart as a whole shows the channel range itself. Including on both sides, price slippage zones (low probability), as well as key support / resistance levels of this secondary trend that exist, and those that will be formed in the future, but will be key for the development of the trend. This can be an addition to the analysis and formation of tactics and money management in other markets, including cryptocurrency.
✅ Telegram. Finance + Trading: t.me/SpartaBTC_1318
✅ Telegram. Сrypto trading only: t.me/SpartaBTC_tradingview
✅ Instagram: instagram.com/spartabtc_1318
✅ YouTube (Rus): goo.su/vpRzRa2
✅ Telegram. Сrypto trading only: t.me/SpartaBTC_tradingview
✅ Instagram: instagram.com/spartabtc_1318
✅ YouTube (Rus): goo.su/vpRzRa2
Related publications
Disclaimer
The information and publications are not meant to be, and do not constitute, financial, investment, trading, or other types of advice or recommendations supplied or endorsed by TradingView. Read more in the Terms of Use.